
Overview
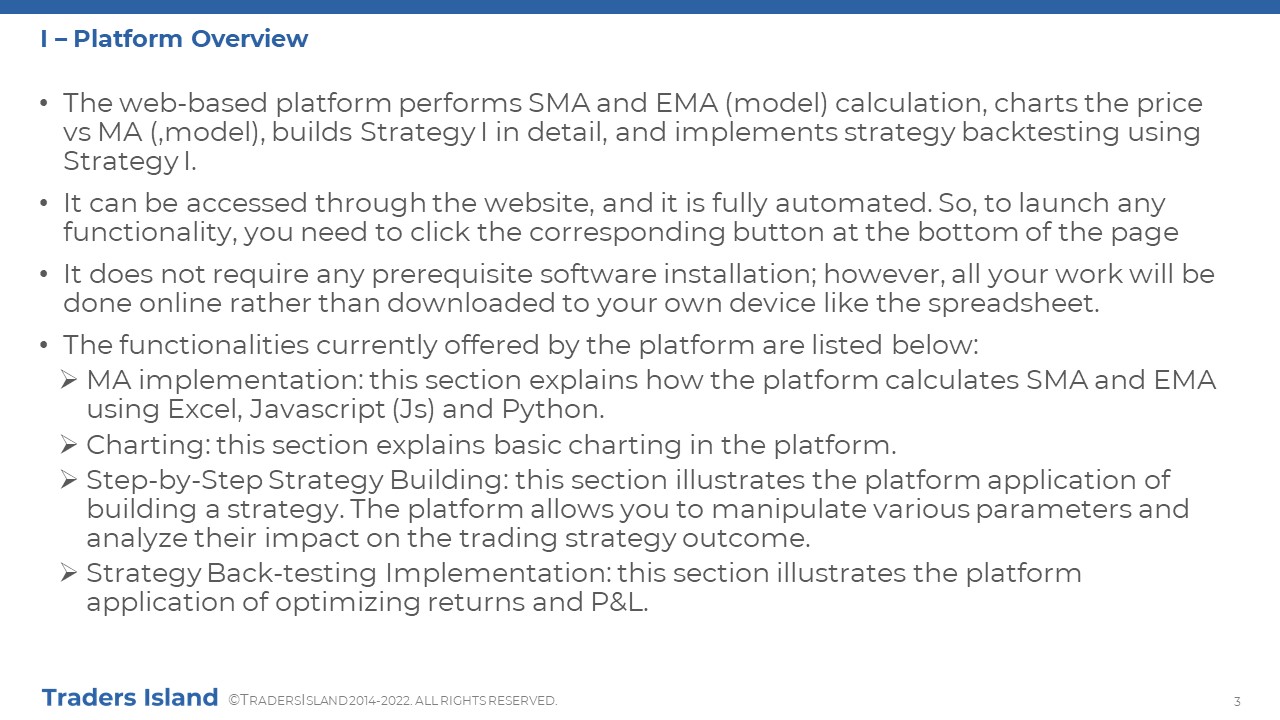
The TI Platform is a proprietary trading education tool that has been custom-built and owned by Traders Island. It is offered for free after registration. This tool is web-based and so it can only be accessed online. It relies on Javascript and CSS code in the front-end interface, and Python code in the backend.
The fact that it is fully automated, including data import, means that you will be able to use your time efficiently and to focus on the task at hand without the headache that can accompany building and coding models. Please note that, at this stage, we have implemented the moving averages models and crucial analysis tools pertinent to this model, namely, charting, strategy building and strategy backtesting for moving averages. The strategy being referred to is defined and explained in the moving averages tutorial. More trading models and strategies are under construction and will be made available in due course. In the meantime, the below sections explain in detail how the platform works. We suggest you familiarise yourself with its functionalities and, once you feel confident that you are ready to start exploring it, you can come back and click the "TI Platform" button above which will take you there directly.

Tabs
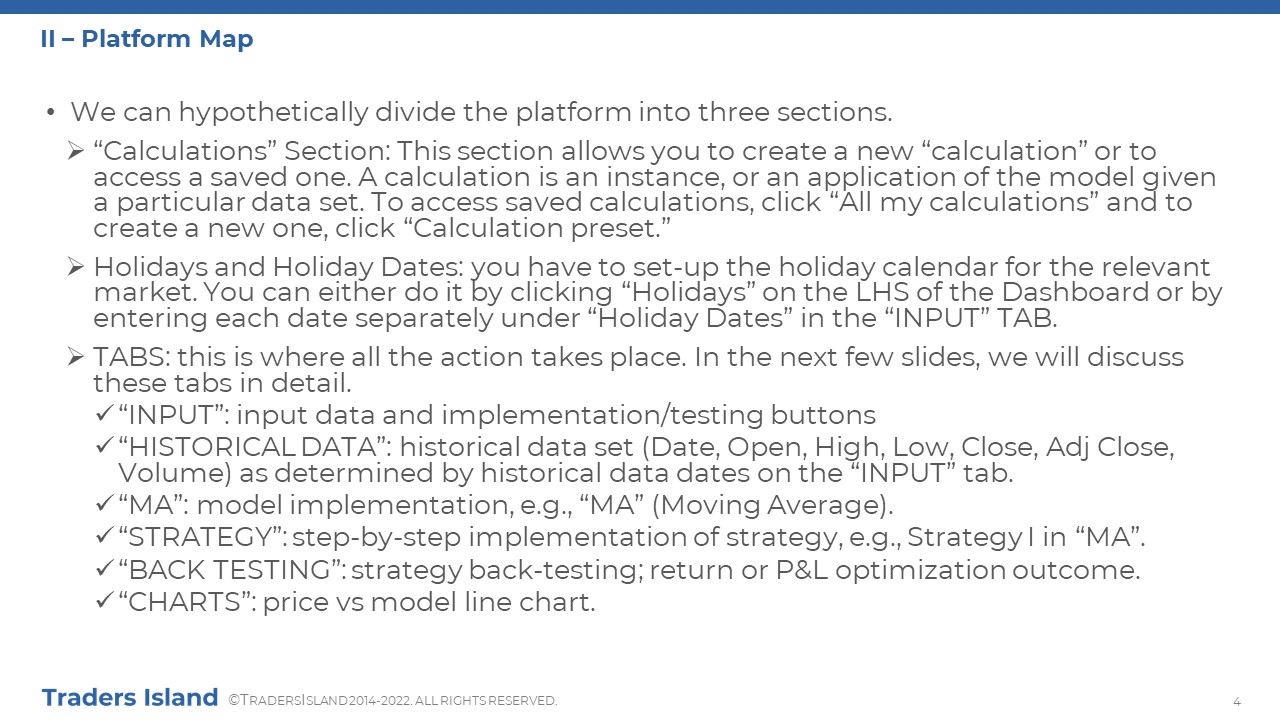
The TI Platform consists of tabs, each representing a different functionality. These tabs are: INPUT, HISTORICAL DATA, MA (model), CHARTS, STRATEGY, and BACKTESTING. The platform is fully automated and so, each tab is generated automatically after you click the corresponding button on the INPUT tab. You can also save your calculation and revisit it later. We will be discussing each tab briefly below but the guide and slides in the following section provide in-depth analysis with illustrations.
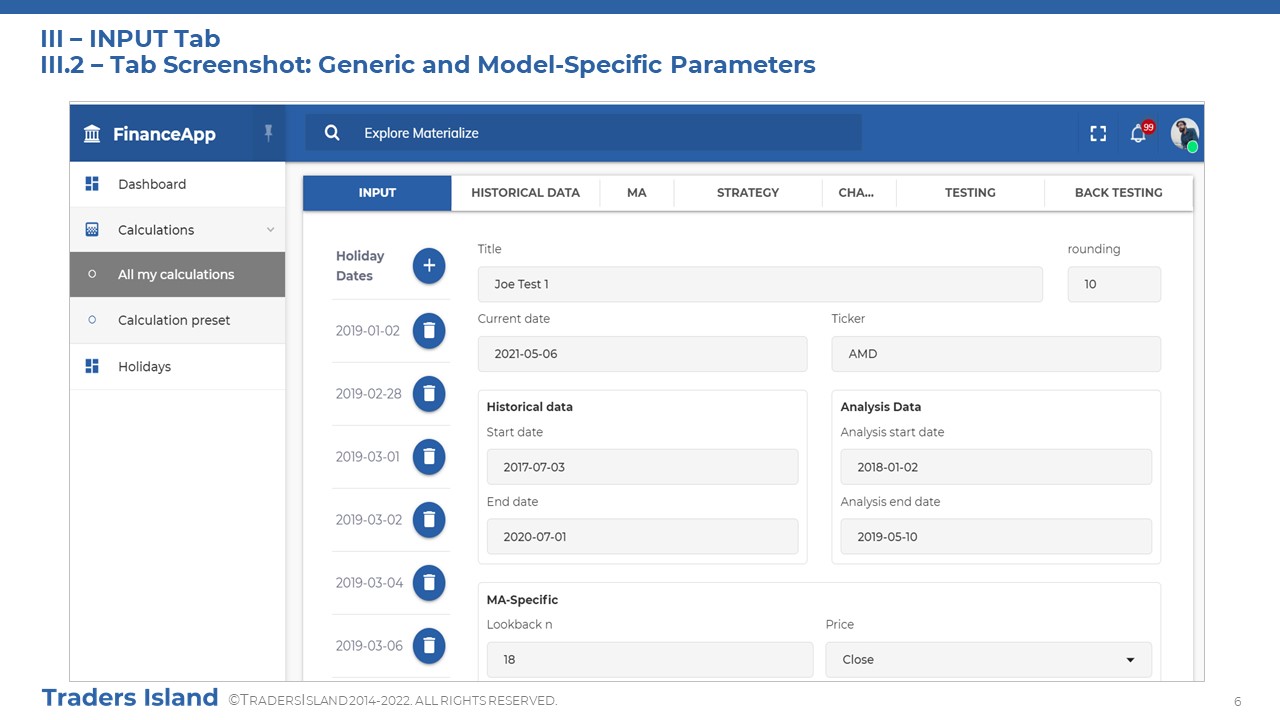
INPUT TAB
This tab is your door to the platform because this is where you update the model parameters and build functionality by clicking the corresponding button. It is divided into sections whereby each section corresponds to parameters pertinent to a particular functionality; however, it is possible for functionalities to share parameters. In a nutshell, you update the required parameters for a particular functionality, click the suitable button and the platform will generate the equivalent TAB.
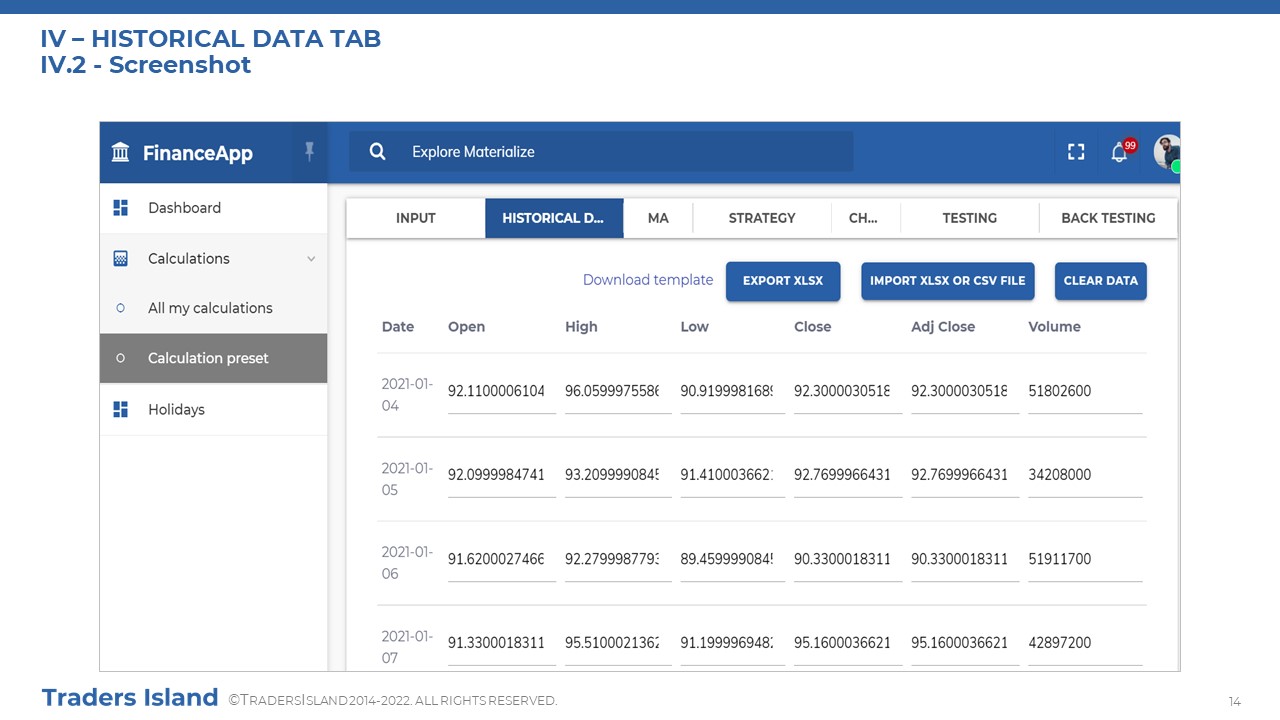
HISTORICAL DATA TAB
This tab houses the complete dataset on which all calculation will rely. It can be either generated automatically through the INPUT tab or exported using an external file. If generated automatically, it will then be determined by the stock ticker and historical data dates that you set on the INPUT tab. The analysis dataset, if different, will be extracted from this dataset; this depends on the analysis data dates you specify on the INPUT tab. On the other hand, you can import your own dataset into the HISTORICAL DATA tab albeit in conformity to a specific template. You can equally export the dataset into a file.
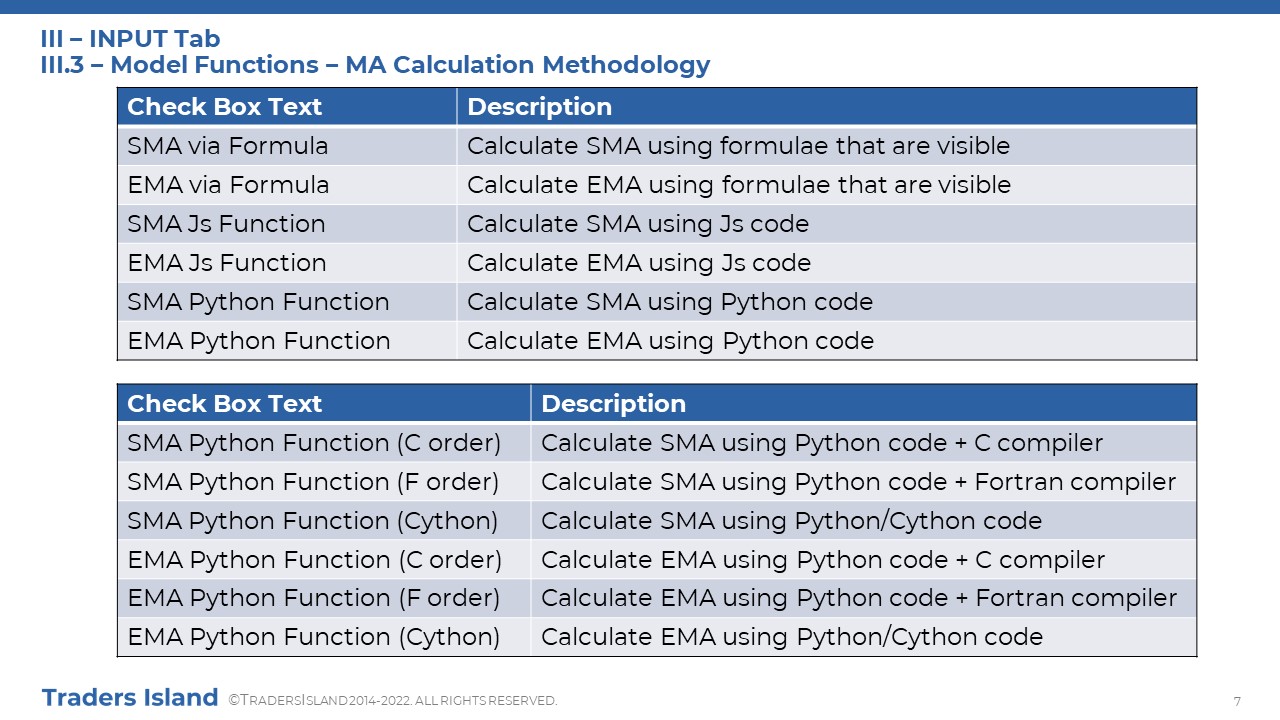
MA (model) TAB
Model computations, currently the moving averages indicator (MA), are performed behind the scenes using Python and Javascript code. This tab will display the results of the model functions that you have chosen on the INPUT tab after defining the corresponding parameters. You can compare the values on the model tab. Those corresponding to the same approach, e.g. SMA, should be equal, which will also prove the accuracy of these values. You will also be able to export the results into a file.
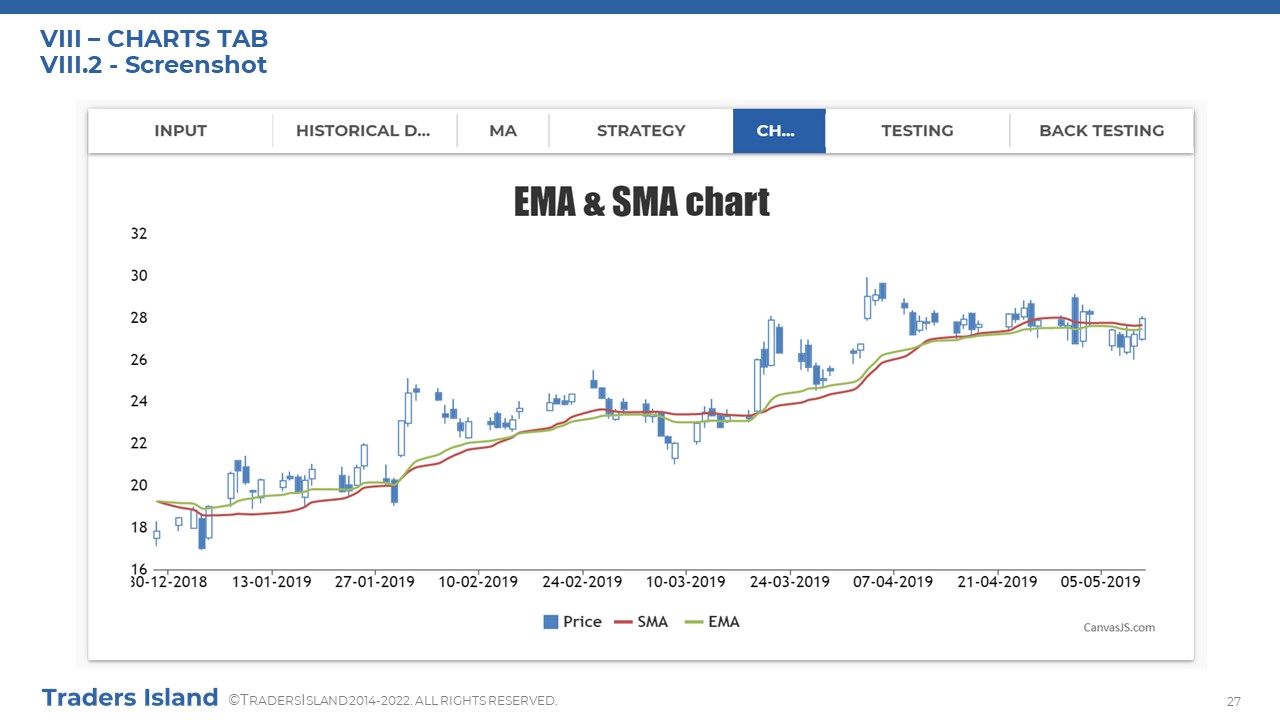
CHARTS TAB
The CHARTS tab plots the price vs model values, in this case MA, across time. Contrary to what you may think though, it is dependent on the HISTORICAL DATA tab but not the model tab since it performs the required calculation backstage. The chart plot uses candlesticks for the stock price with the model values superimposed on it as lines. This will help you visualise crossovers and understand the relevant trading strategies explained in the tutorials.
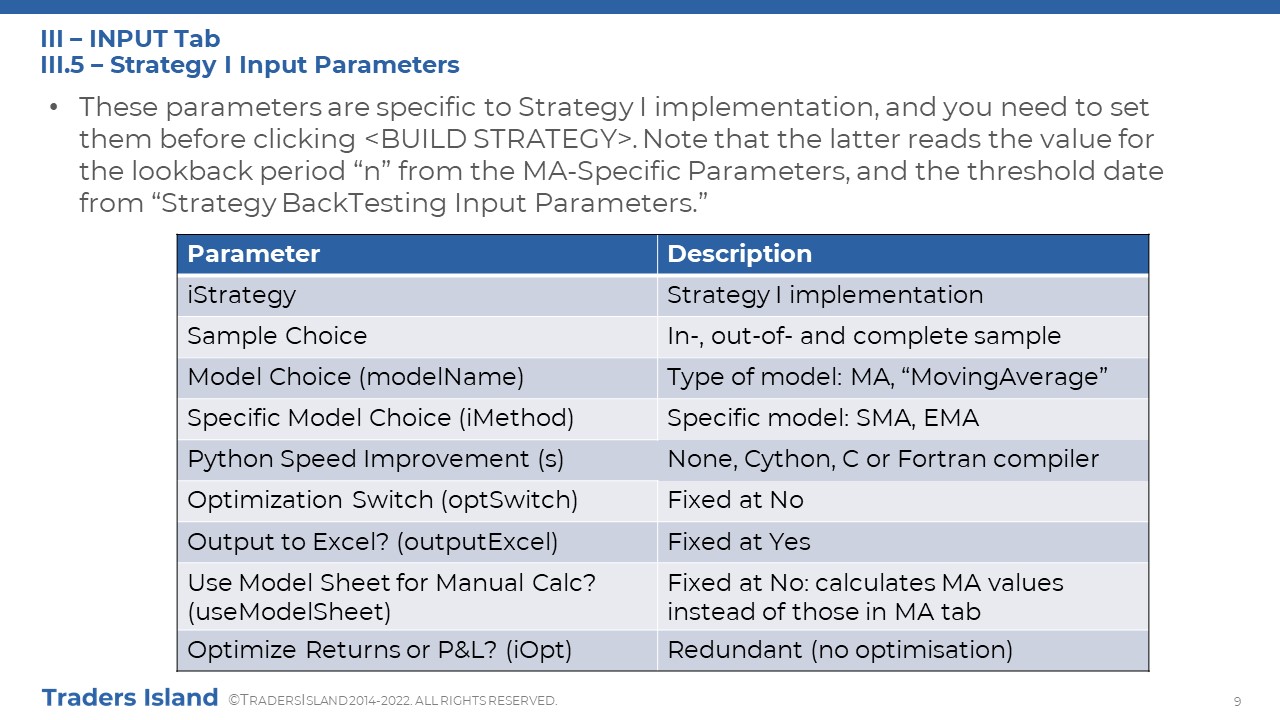
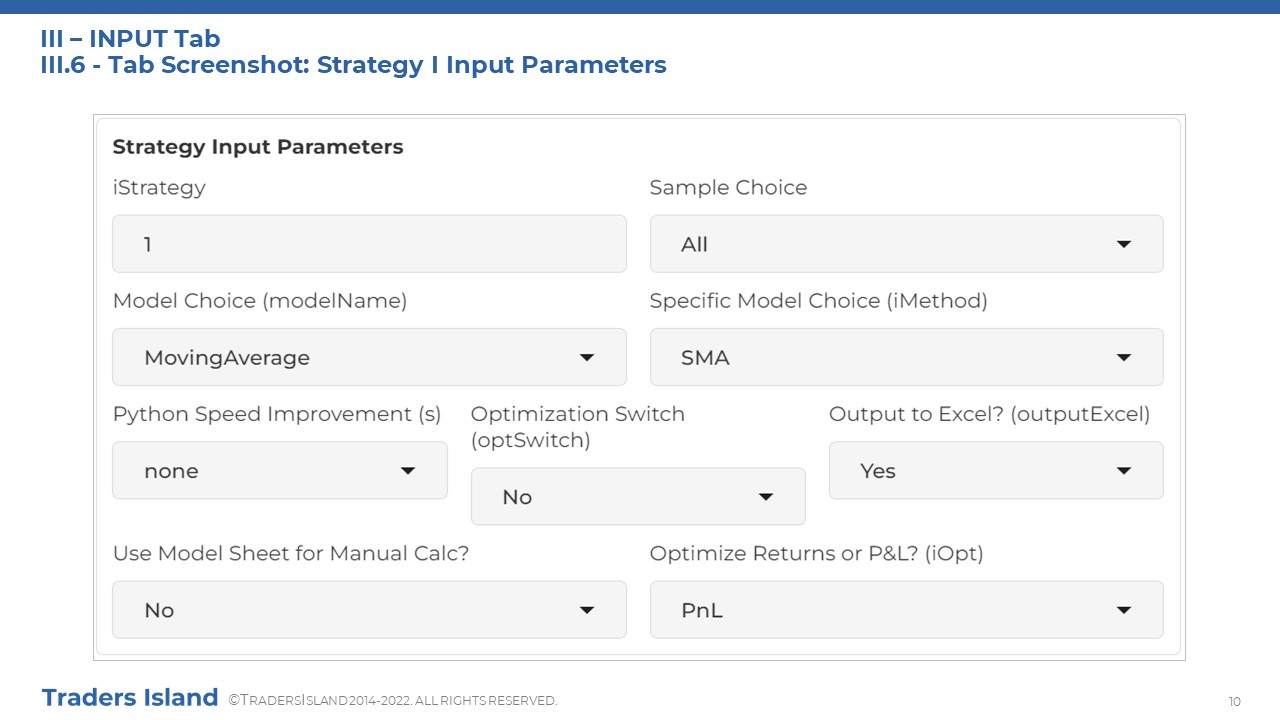
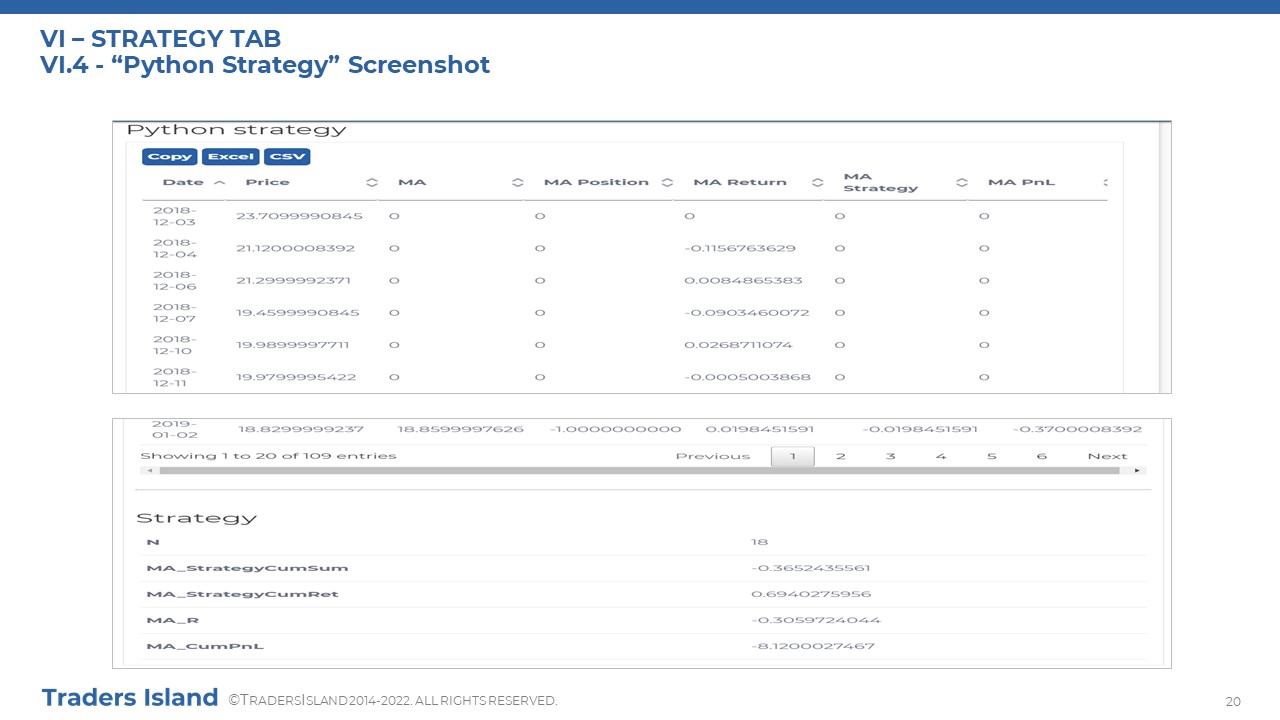
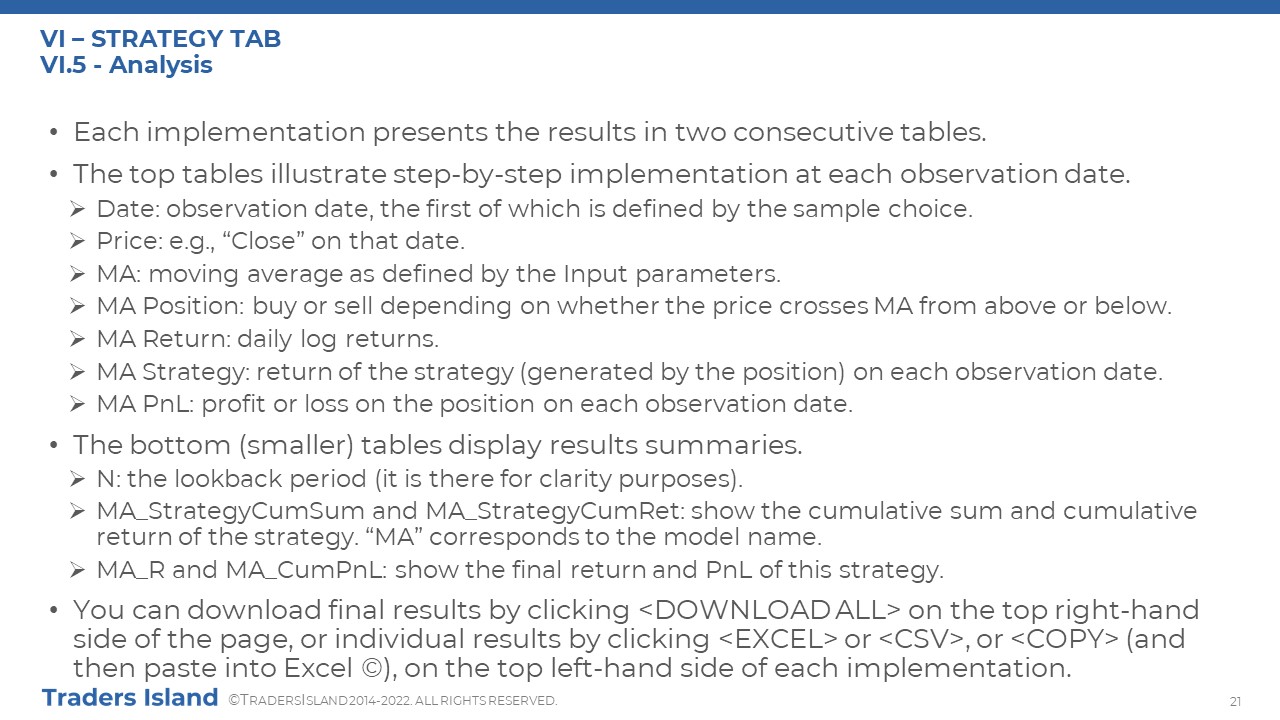
STRATEGY TAB
The STRATEGY tab illustrates to you the nitty gritty details behind a trading strategy calculation, which is presently Strategy I; you can find out more about this strategy by referring to the Moving Averages tutorial. This functionality is fully automated and only requires you to update the respective parameters and click the required button on the INPUT tab. You will notice that there are three blocks of calculation on the STRATEGY tab, each corresponding to a different implementation tool (“Excel”, Javascript and Python). All three blocks should produce the same results. They are there to grant you extra reassurance of the correctness of the values that you see on this tab. Please note that the term “Excel” is used loosely in concurrence with the TI Spreadsheet notation. Here too, you will be able to export the results into files.
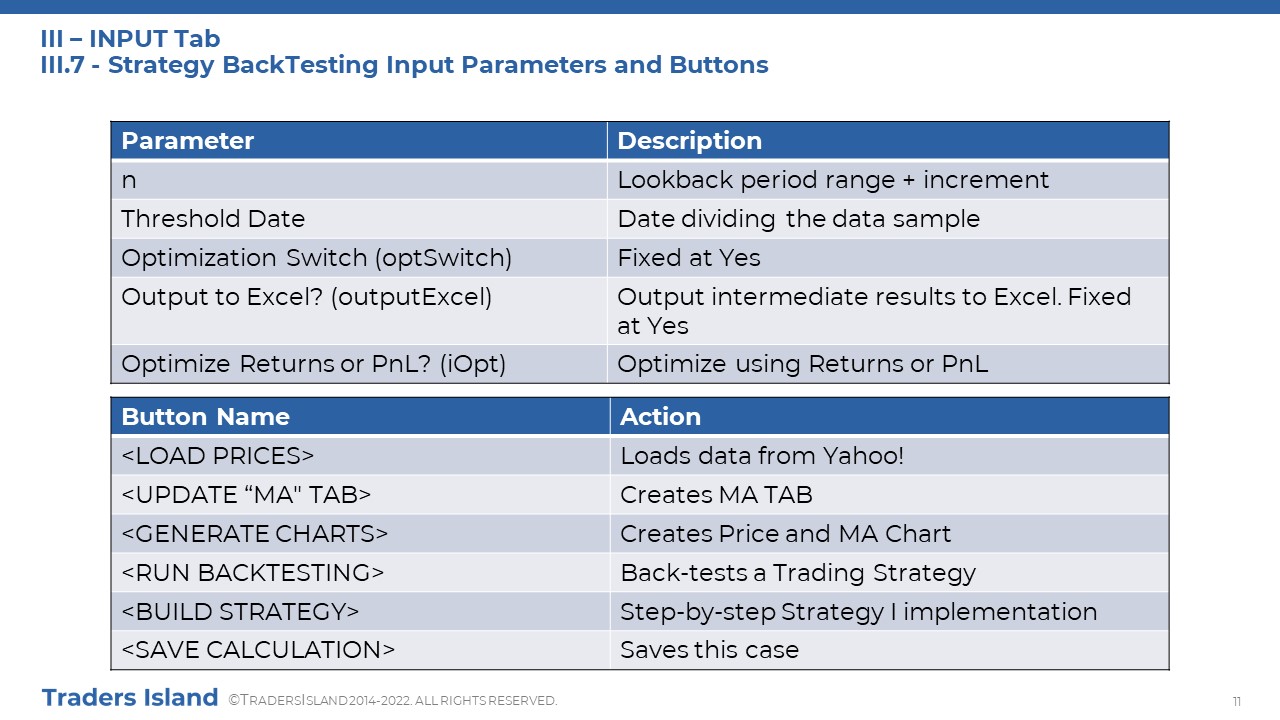
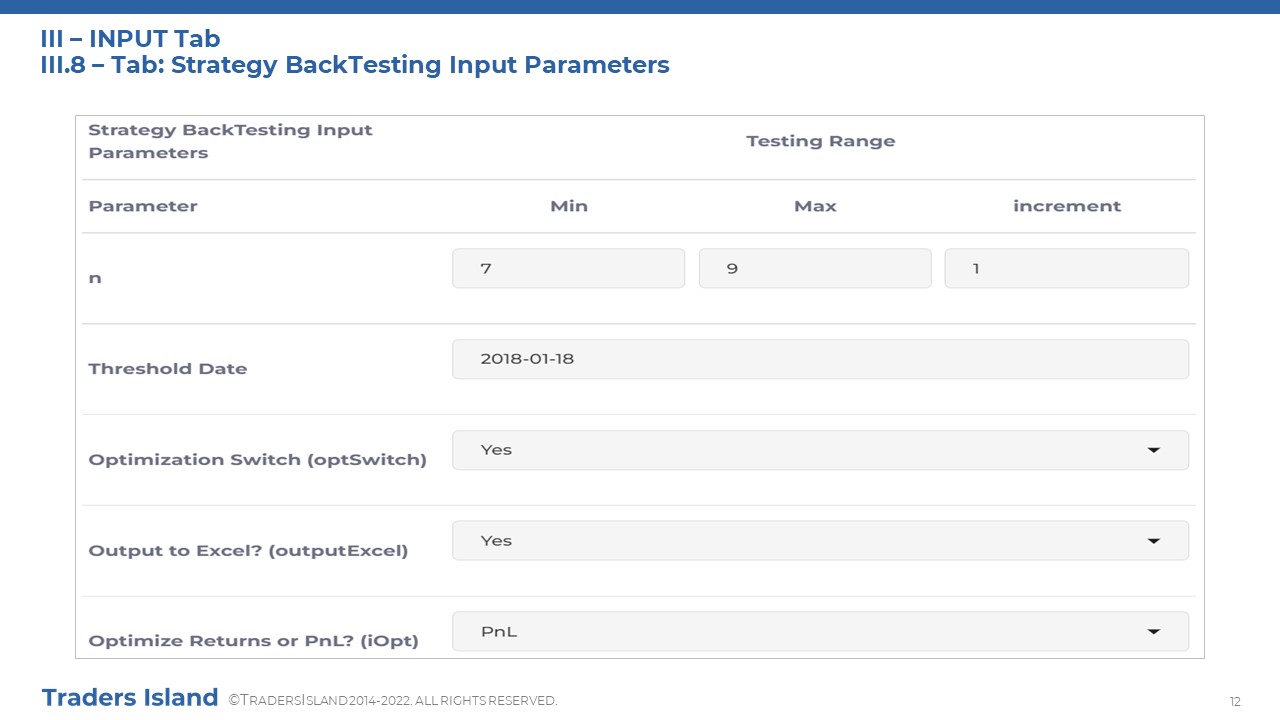
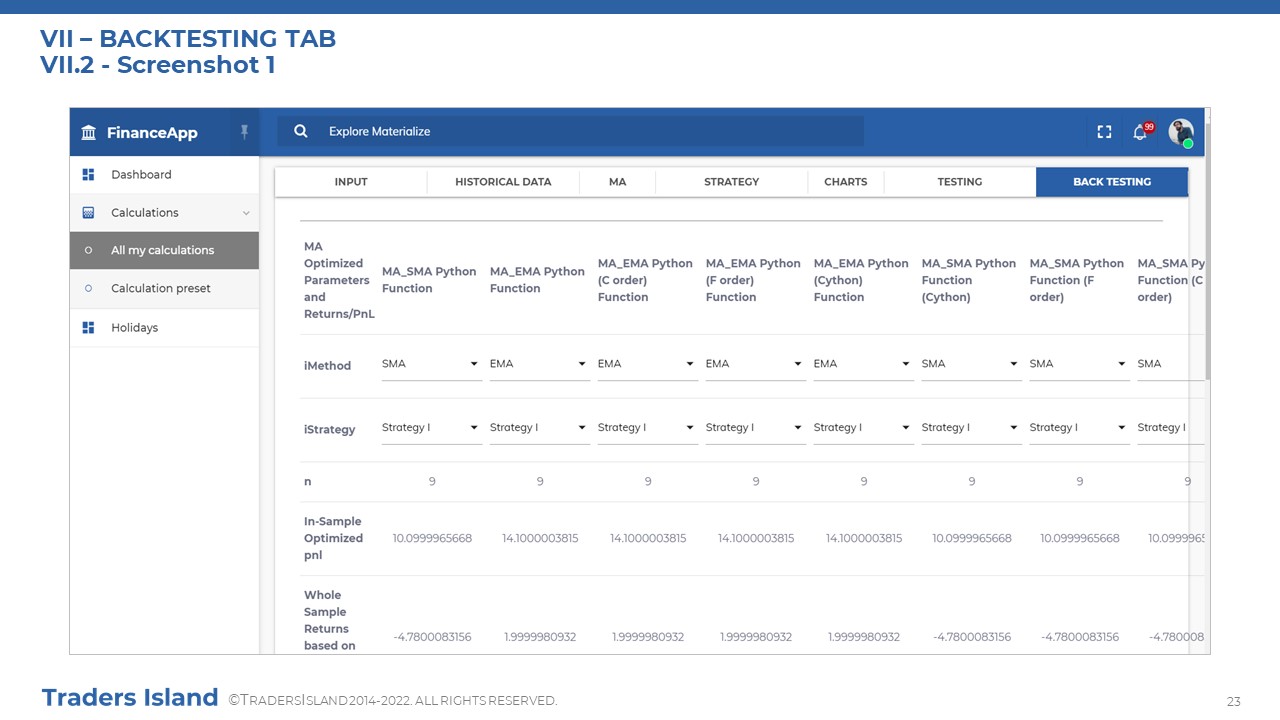
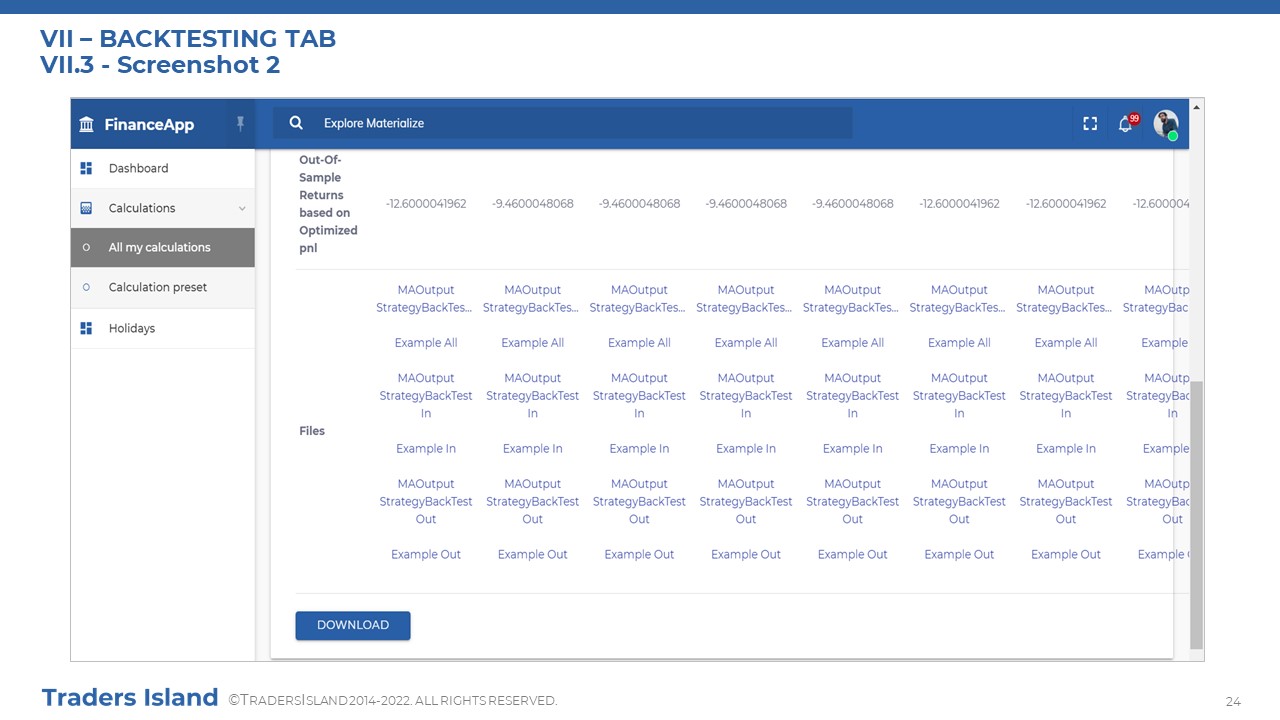
BACKTESTING TAB
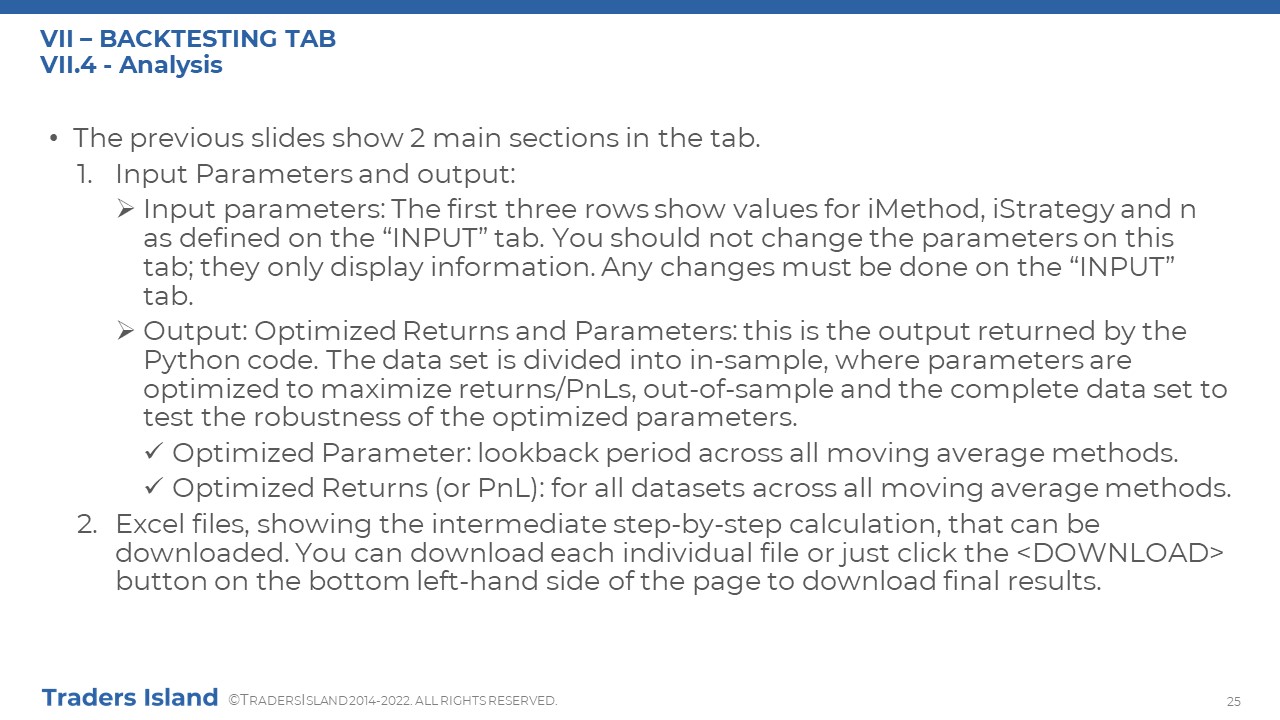
The BACKTESTING tab displays the results for the strategy backtesting computation. The strategy backtesting calculation uses historical data to back-test a trading strategy by optimising certain parameters such that the strategy returns or P&L (profit and Loss) is maximised. Again, Strategy I is currently the trading strategy in focus; to brush up on strategy backtesting theory and application, you may like to refer to the Strategy Backtesting tutorial. This is also where the STRATEGY tab comes in handy. As the calculation behind backtesting is invisible, the STRATEGY tab will illustrate what would be going on in the background. The tab also allows you to export the results into files.

Guide
Now that you have had a brief overview of the basic functionality of the platform and the various tabs that comprise it, you may like to further explore the platform. This section does exactly that! To this end, you will be able to download the platform user manual, which takes you through the details of the tab functions as well as explains to you how to work with them, or go swiftly through the below presentation.
First things first though! Before getting your hands dirty with the functionality on offer, you need to access the platform. Accessing the platform cannot be easier.
- Click the "TI Platform" button above to follow the link and this will take you to the platform's login page.
- If it is your first time, you need to register before you can use the platform. To do so, scroll down and click "register."
- All you need to do is to provide your name and email address, and tick a couple of boxes to accept legal statements. We will then send a password to your email address.
- You must use this password and your email address to sign into the platform. And you're in!
Obviously, you would like a heads-up before starting to get your hands dirty with the functionalities on offer. You can download the below user manual now and use it to guide you through the platform. Alternatively, you may prefer to take a skim through the below presentation for a glimpse of the tabs.
The aim of the below presentation is to familiarise you with the various tabs on the platform. It is not meant to be a comprehensive guide. If you are more interested in a step-by-step explanation of how to use the platform, you may like to refer to the above user manual. Alternatively, you may prefer to review the sections on platform notes in the Moving Averages or Strategy Backtesting tutorials. In fact, there is a lot of common slides between the below presentation and these in the platform notes of the tutorials with the latter being more comprehensive. So, if you are comfortable with those, you do not need to go through the below presentation.


FAQs
Do you have a question on the TI Platform and how it compares to the TI Spreadsheet? Check out the answers to some popular questions below. Alternatively, write to us!
Do I need to have a good grasp of moving averages and strategy backtesting before venturing into the TI Platform?
It is advisable that you at least skim through the tutorials. These tutorials do not just introduce you to the theory (and you may not need the theory indeed!) but also they take you through step-by-step applications that you can utilise when using the TI Platform.
What is the difference between the TI Platform and the TI Spreadsheet?
Both tools offer the same basic functionality. The TI Spreadsheet offers you an extra functionality to test the code in an automated manner when some parameters change. Moreover, whilst the TI Spreadsheet is downloadable on your personal device for a small fee, the TI Platform is provided free of charge, albeit it can only be accessed online through the website.
Before You Go...

Moving Average
Take me back to the Moving Averages tutorial. I would like to brush up on moving averages and the corresponding strategies!

Strategy Backtesting
Take me back to the backtesting tutorial. I would like to understand this concept really well before exploring applications!

The TI Spreadsheet
I am comfortable with the platform but I would like to find out more about the spreadsheet before I decide which tool is for me.