Introduction
You may have heard about moving averages over and over again, and not just in trading. However, the difference between moving averages in trading and that in other disciplines is that it is one of the most popular tools in the former domain, be it for actual trading or for gauging the performance of the market in general or a specific stock in particular. So why moving averages and why should you care? In this tutorial, we hope to answer this question. We give you an overview of the moving average indicator and two of the most popular moving average methodologies. We discuss some of the intricacies in moving averages. Then, we move on to present three of the most popular trading strategies that are based on this concept. We finally conclude by introducing you to the fully-automated tools that we offer you on this website and which help you apply what you have learnt, namely the platform and the spreadsheet.

A Brief Overview
- The Moving Average (MA) Indicator is a trend-following or lagging indicator. The term " Moving " indicates a rolling window.
- In its simplest form, the Moving Average computes the average value of data over a specific lookback period, e.g., a 10-day MA computes the average price for the past 10 days and a 50-day MA computes the average price for the past 50 days.
- It is usually applied to daily closing prices; however, it can also be applied to other entities such as volume, etc..
- It indicates the current direction of the market (up or down; bullish or bearish).
- It can also be used to identify resistance and support levels.
- As such, it is used in various trading strategies.

What to Watch out for
- It is lagging because it looks at past values. So you may miss the first part of a major move.
- It only tells you what the market has been doing based on historical data.
- It only identifies a top or bottom after they occur.
- It does not predict the direction of future prices.
- Keep an eye on the time period. The choice of lookback period affects the moving average results.
- Always listen to what the data is saying, A time period that works for a particular asset at a particular time may not necessarily work for another asset or the same asset at a different time
- More importantly, understand your trading goals and horizon because they affect the time period you will choose.

Lessons
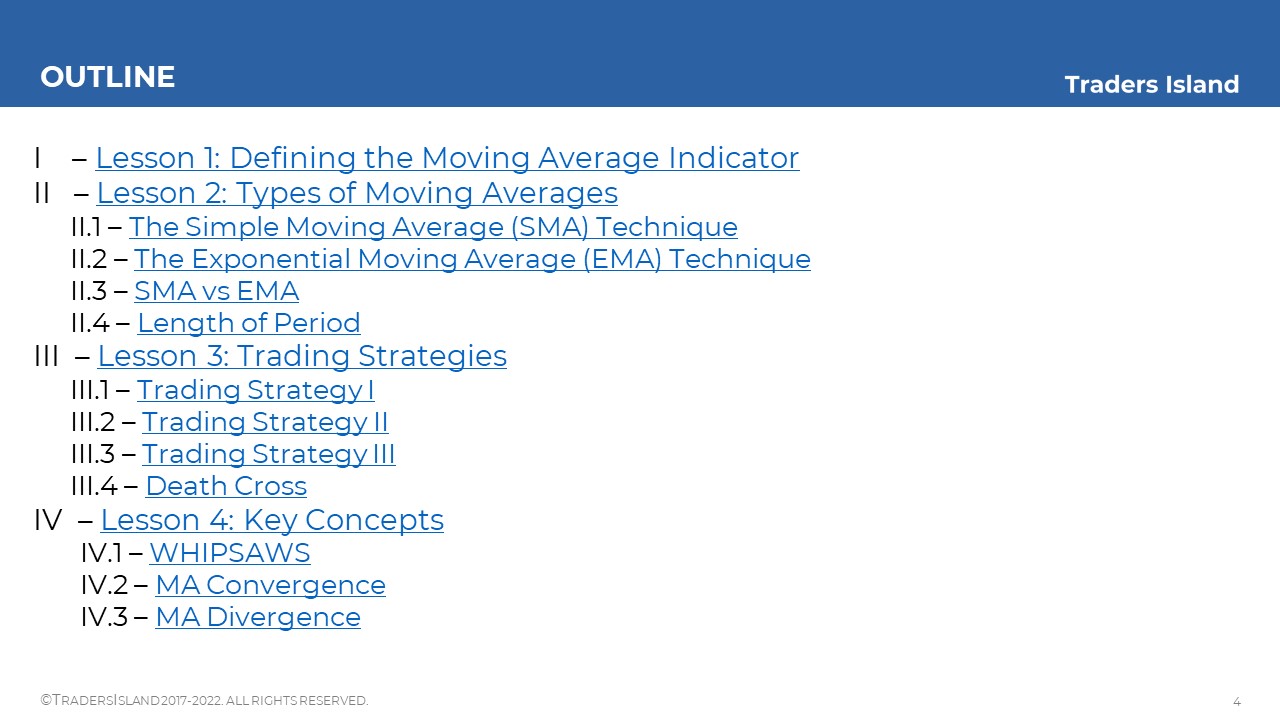
In the following sections, we will be looking into the Moving Average Indicator in depth. The lessons on this page are just a taster of what is covered in the below course notes. The tutorial will be divided into two main parts: a theory part and an application part.
The theory part is covered in four lessons and it explores the theoretical foundation of, in addition to trading strategies based on, the moving average indicator. The application part is divided into two further lessons explaining the web-based platform application and the downloadable spreadsheet application separately. You will be able to download these two lessons as two separate pdf documents for free.
I - Lesson 1: Definition
The Moving Average is a crucial tool in Technical Analysis. As we have mentioned above, it is a trend-following indicator, which means that it “follows the trend” in the sense that it gives an indication of the direction of price movement. If it is slanting upward, then it indicates that the market or stock price follow an upward move, which can be interpreted as bullish; on the other hand, if it is slanting downward, then it indicates that the market or stock price is following a downward move, which can be interpreted as bearish. However, it is not just the slope of the moving average that is interesting. The behaviour of the price vis-à-vis the moving average can indicate trading signals. Therefore, it is possible to use this concept to establish patterns upon which to build trading strategies. Slides 5-7 cover the definition and basic uses of the moving average as a trading tool.
II - Lesson 2: Types of a Moving Average
There are several types of a moving average, the most popular of which are the Simple Moving Average (SMA) and the Exponential Moving Average (EMA). They mostly differ in how they handle old and new prices. In summary, SMA assigns equal weights to all prices while EMA ascribes more weight to recent prices. Slides 8-18 discuss this topic in depth.
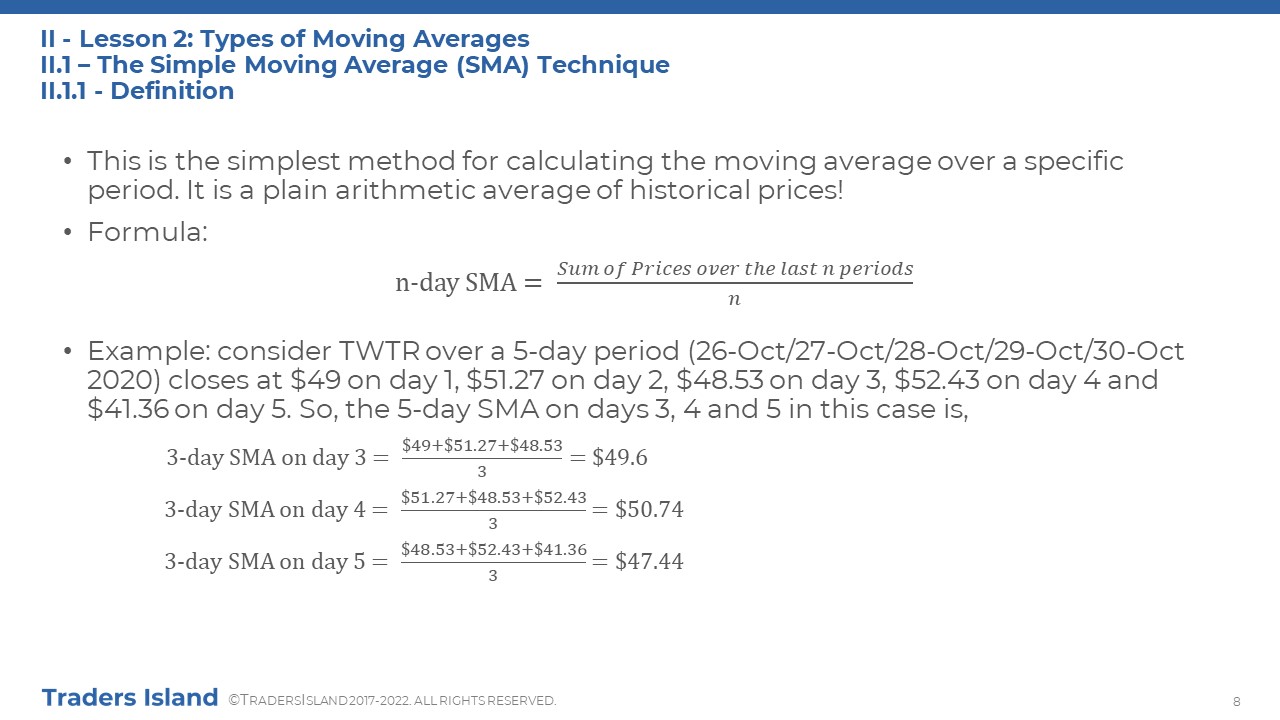
II.1 - Simple Moving Average
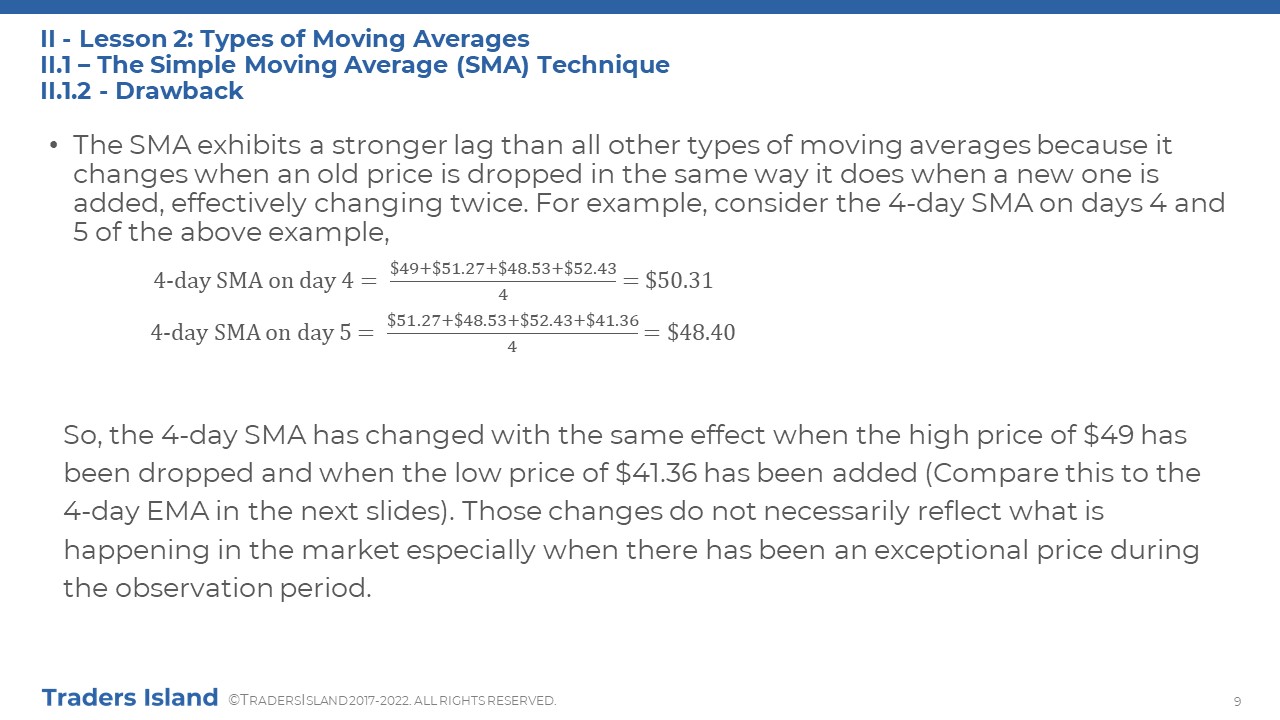
The Simple Moving Average (SMA) is the simplest form of a moving average. It is calculated as the arithmetic average of past prices. So, it assigns the same weight to all past prices though, which entices some traders to opt for EMA (next). Slides 8-9 explain the theory behind SMA in more detail and a worked example is shown in the spreadsheet notes.
II.2 - Exponential Moving Average
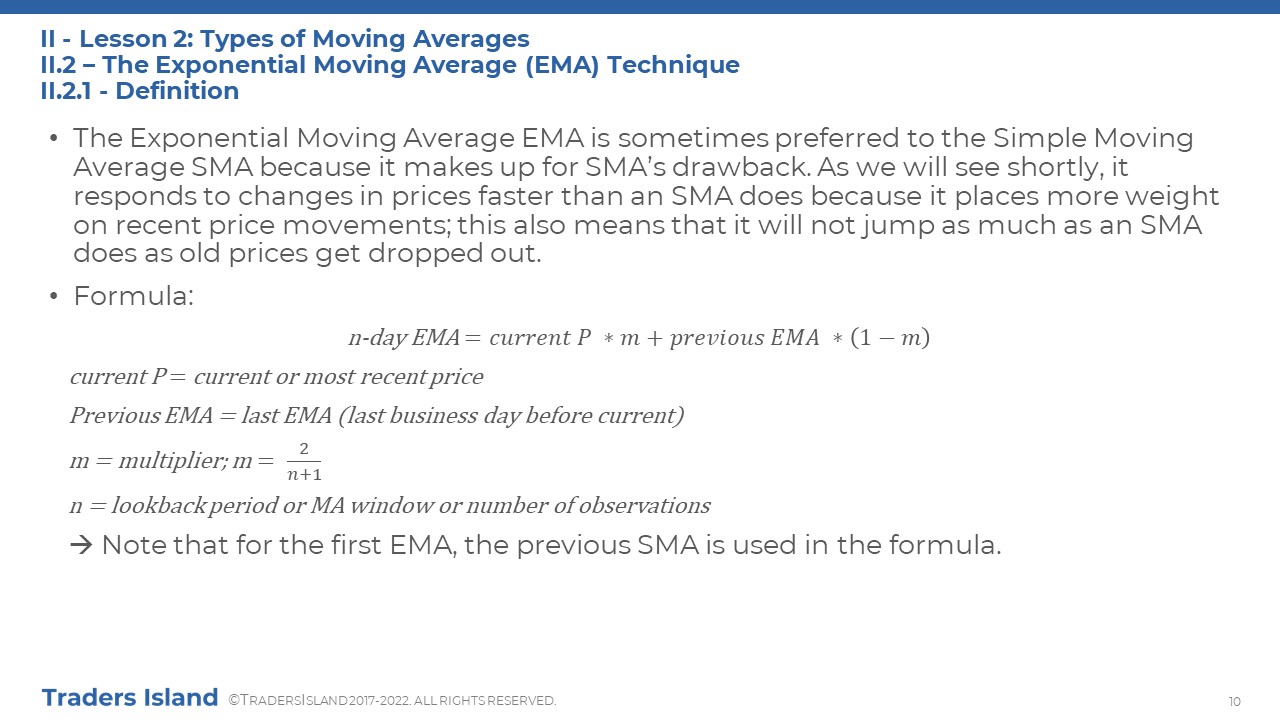
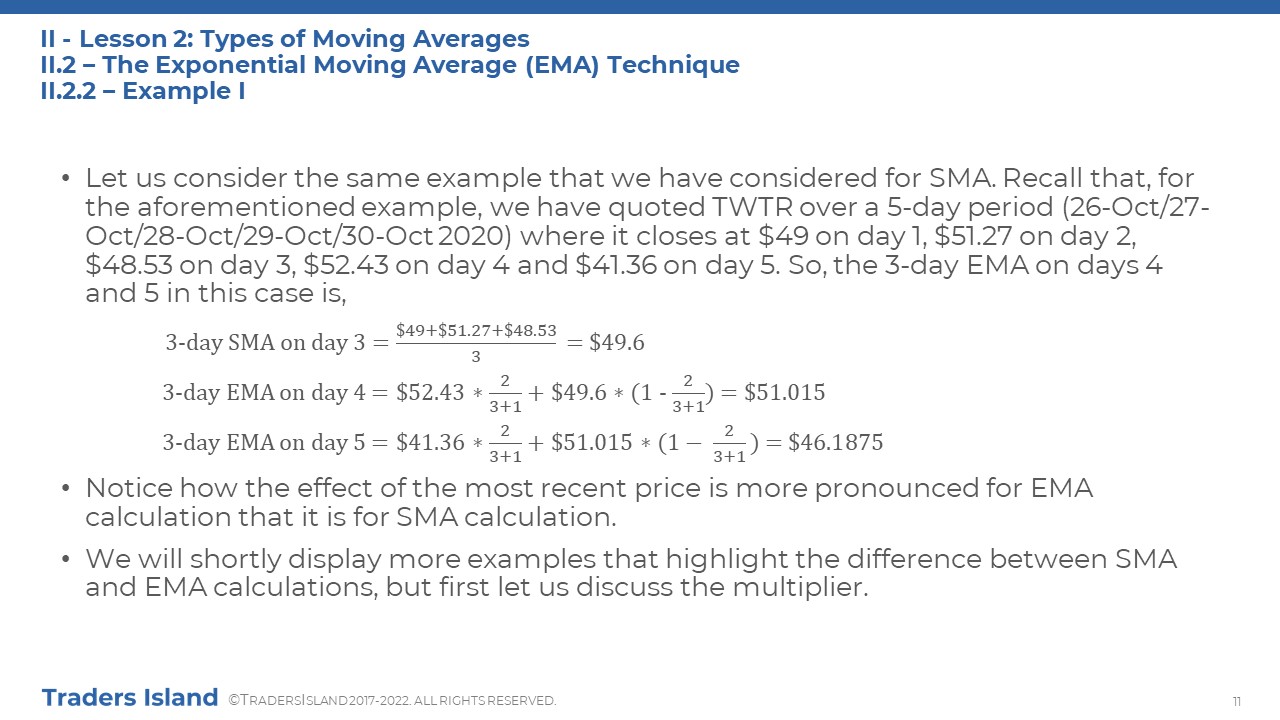
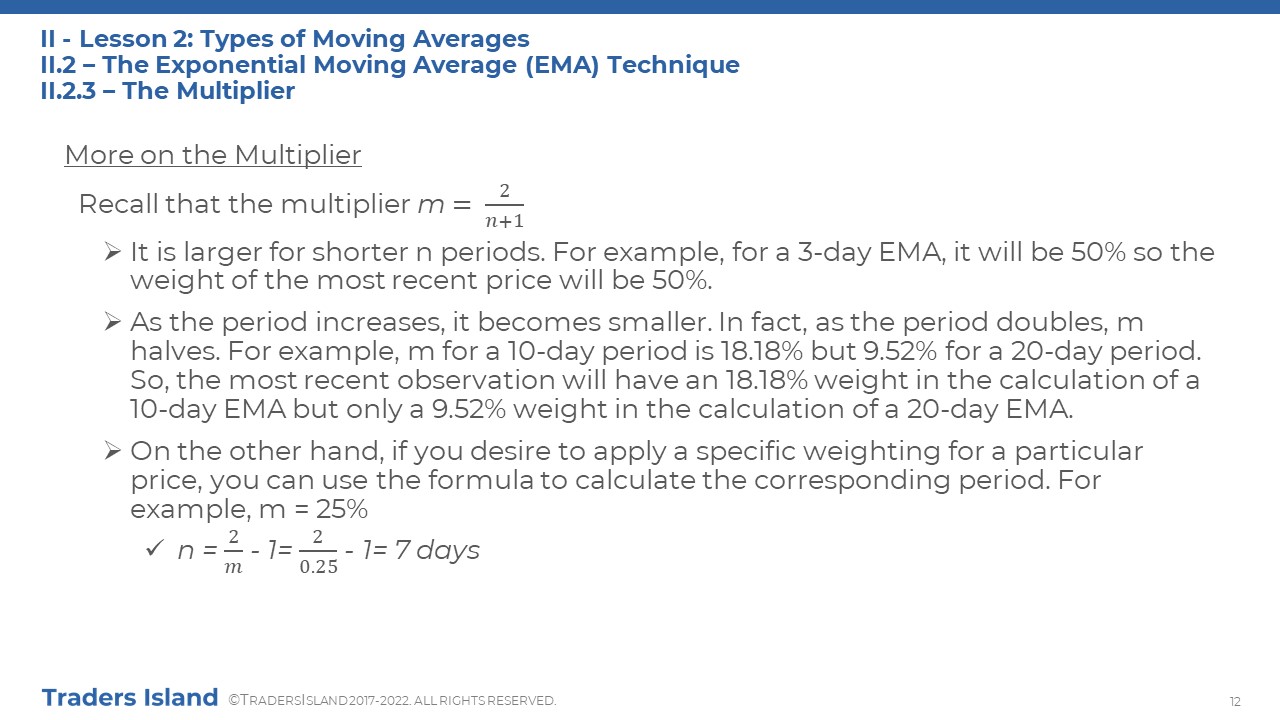
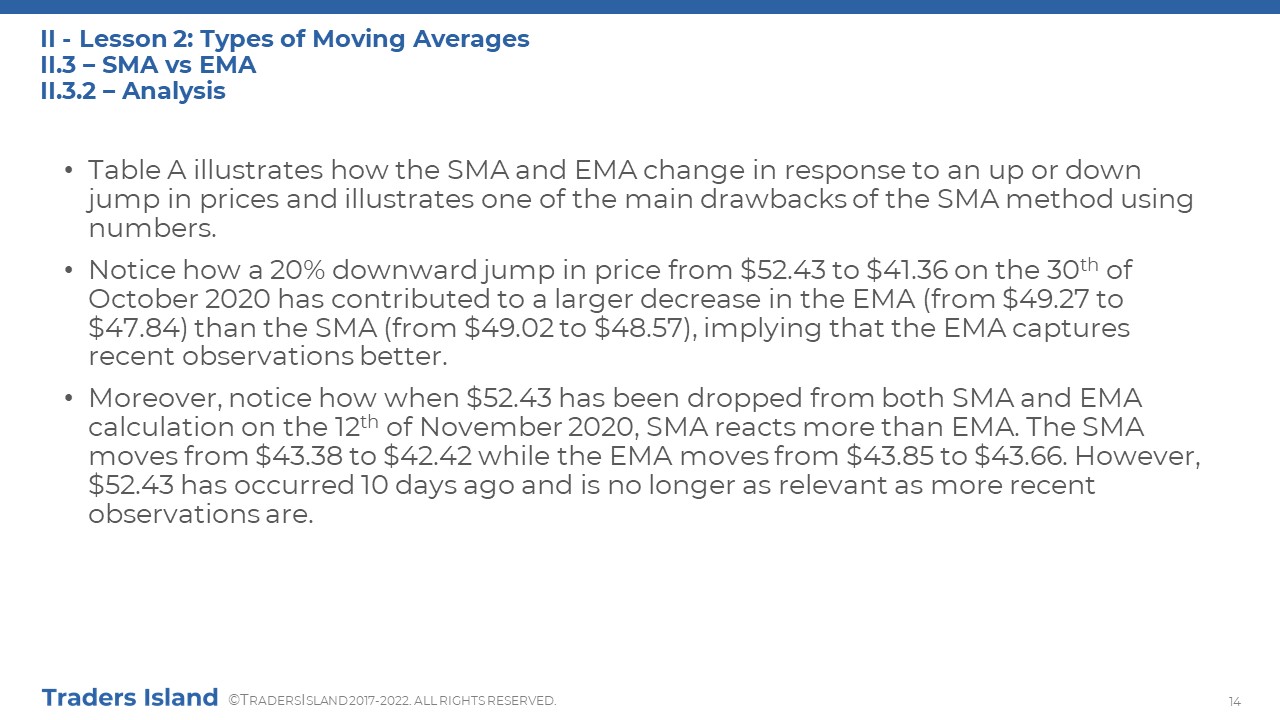
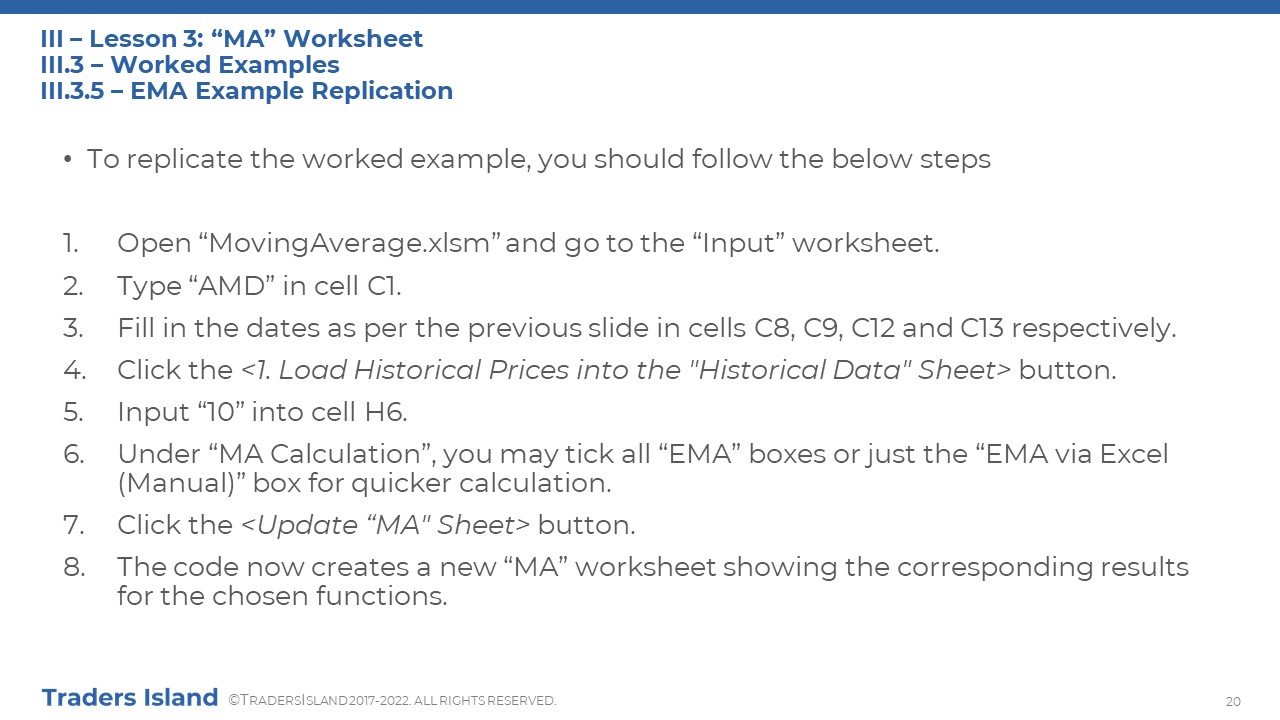
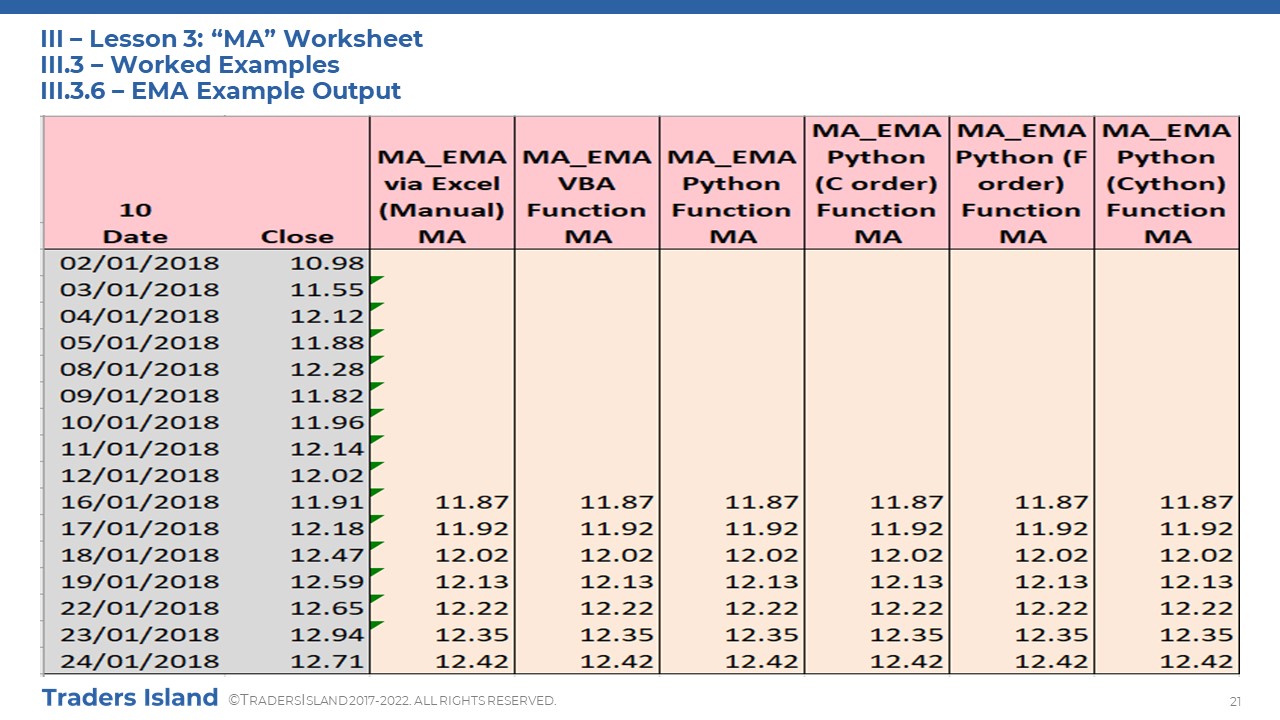
The Exponential Moving Average (EMA) is a weighted moving average that is trumpeted as a better indicator than SMA because it assigns more weight to recent prices. Slides 10-12 explain the theory behind EMA in more detail and a worked example is shown in the spreadsheet notes. We also show a comparative example between SMA and EMA in II.3 (Slides 13-14).
II.4 Choice of Period Length
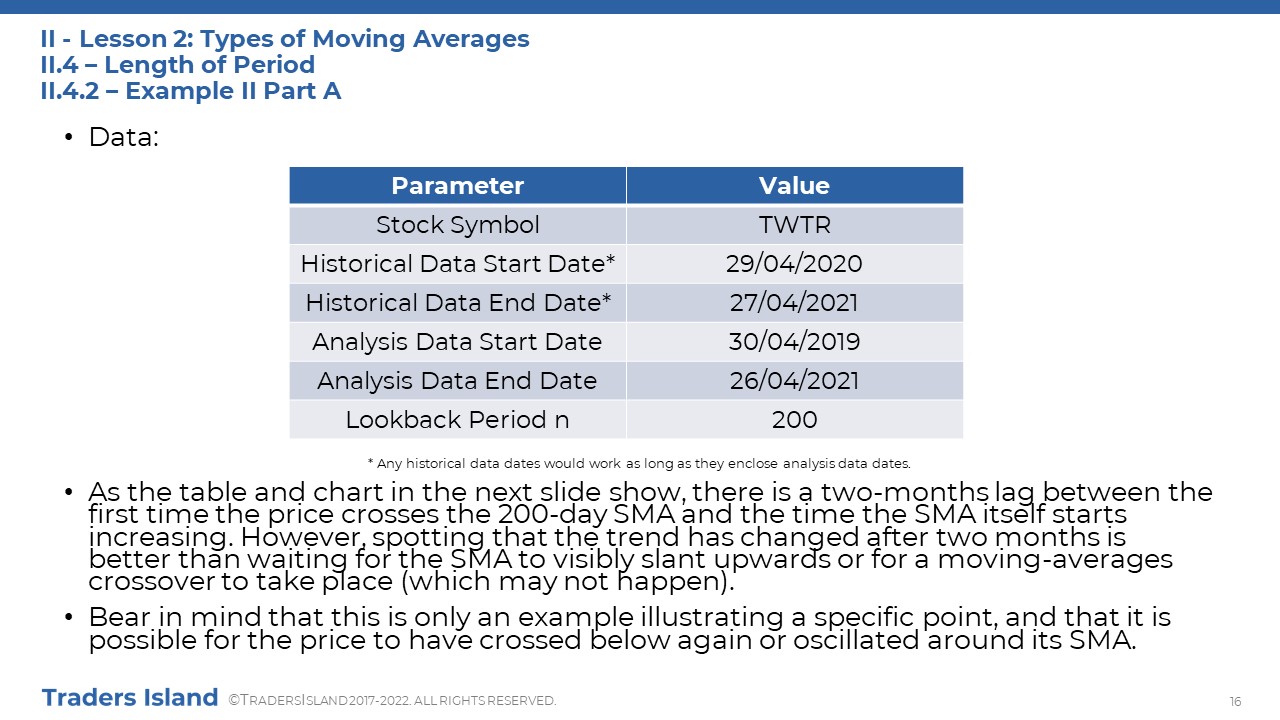
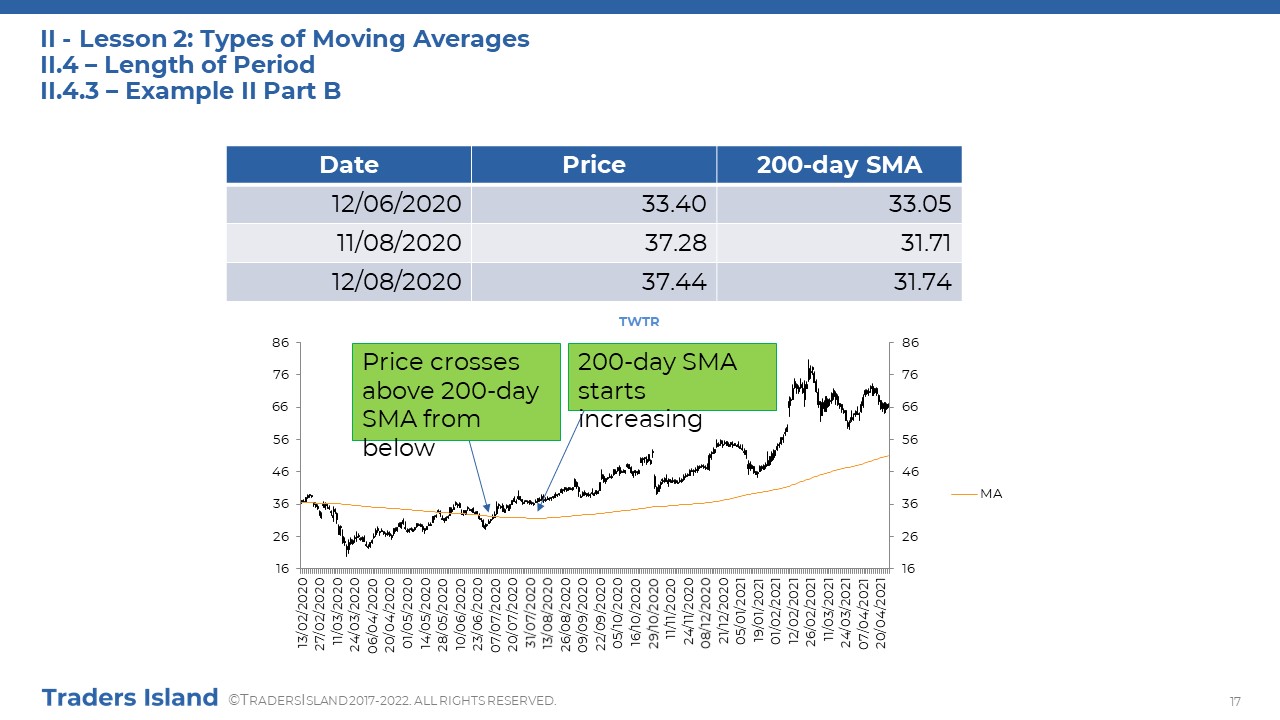
Here, we take a short digression to discuss the choice of lookback period length before moving to trading strategies. The choice of period length is very important because it can directly impact your trading decisions by affecting trading signals. First of all, try to match the period length to your trading or investment horizon. If you are a day trader, you may consider minutes or even seconds while, if you are a medium- to a long-term investor, you may like to consider 50 or 200 days. Another important point to account for is the duration of the trend you are looking at. Similarly, to the above point, a longer trend is measured by a longer-term moving average and a shorter trend is measured by a shorter-term moving average. Keep in mind though that a longer-term moving average means that you will be missing the first part of a move. On the other hand, a shorter-term moving average can give plenty of signals in a short period of time. Slides 15-18 explain this topic in more detail with examples.
III - Lesson 3: Trading Strategies
Moving averages can be used to build trading strategies, depending on the market environment and the investment or trading horizon. In this tutorial, we will look into three of the most common moving average trading strategies.
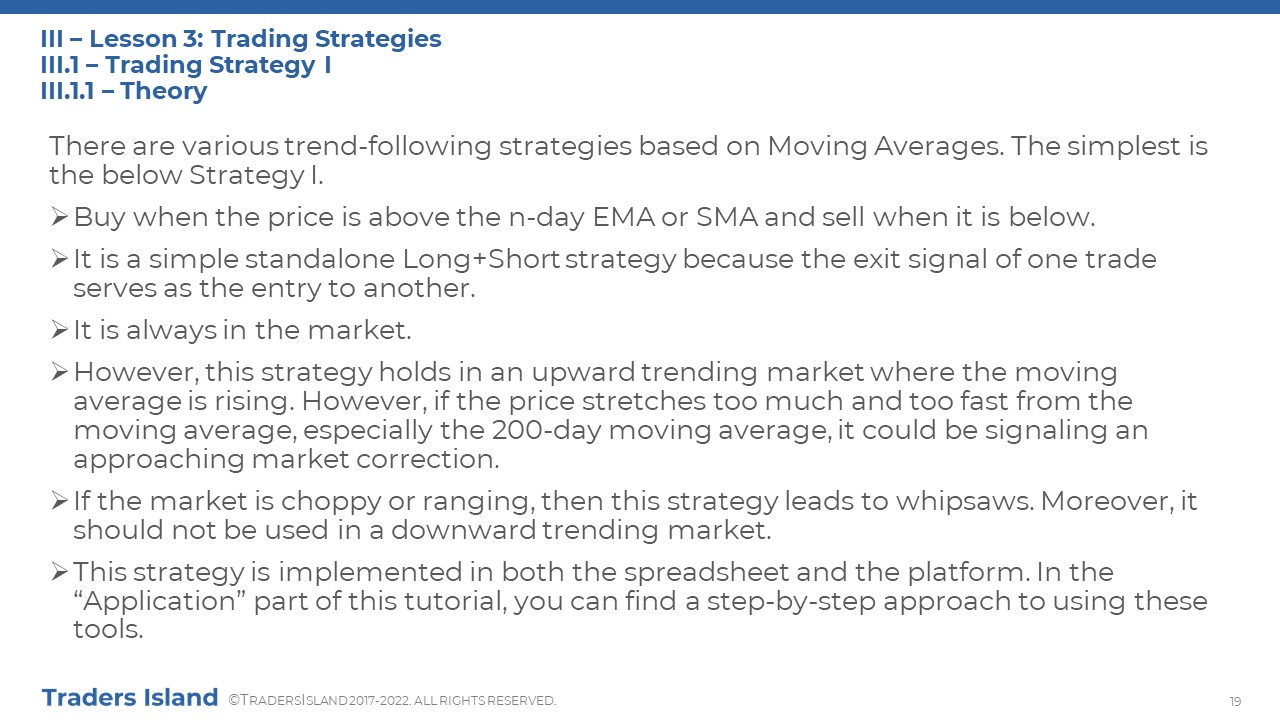
III.1 - Trading Strategy I
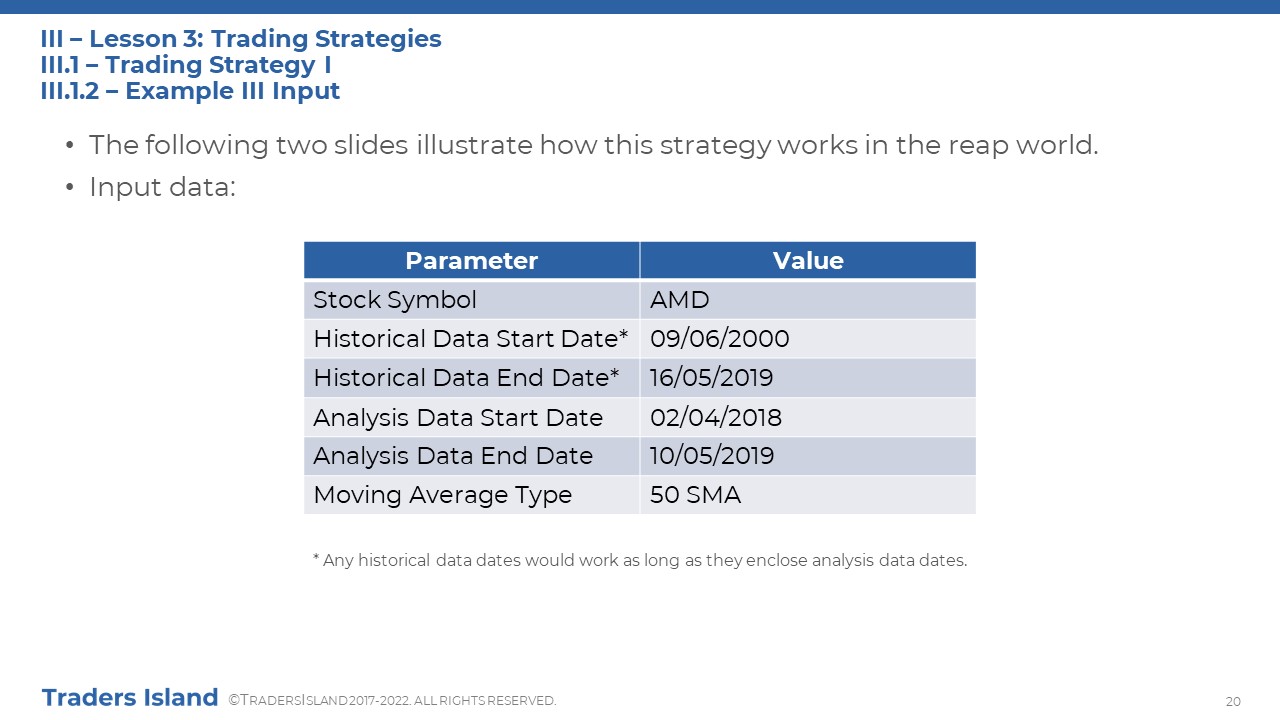
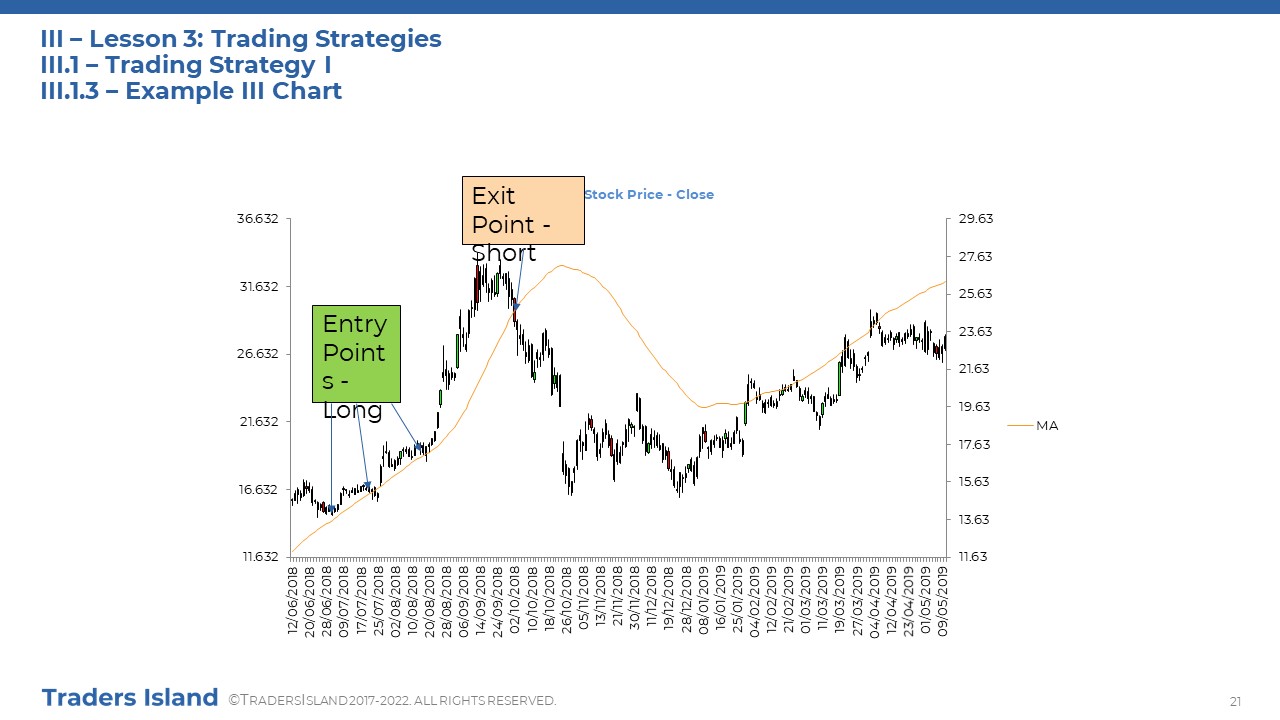
This is the simplest and most popular trend-following strategy; it holds in a bull market. In summary, it gives a buy signal when the price crosses above the moving average and a sell signal when the price crosses below the moving average. However, the length of the lookback period affects the outcome of this strategy. Slides 19-21 below explain this strategy with illustration. It is always important to bear in mind that this strategy does not hold in every market. Slides 37-38 explain how you can get “whipsawed” if you use a moving average strategy when you are not supposed to.
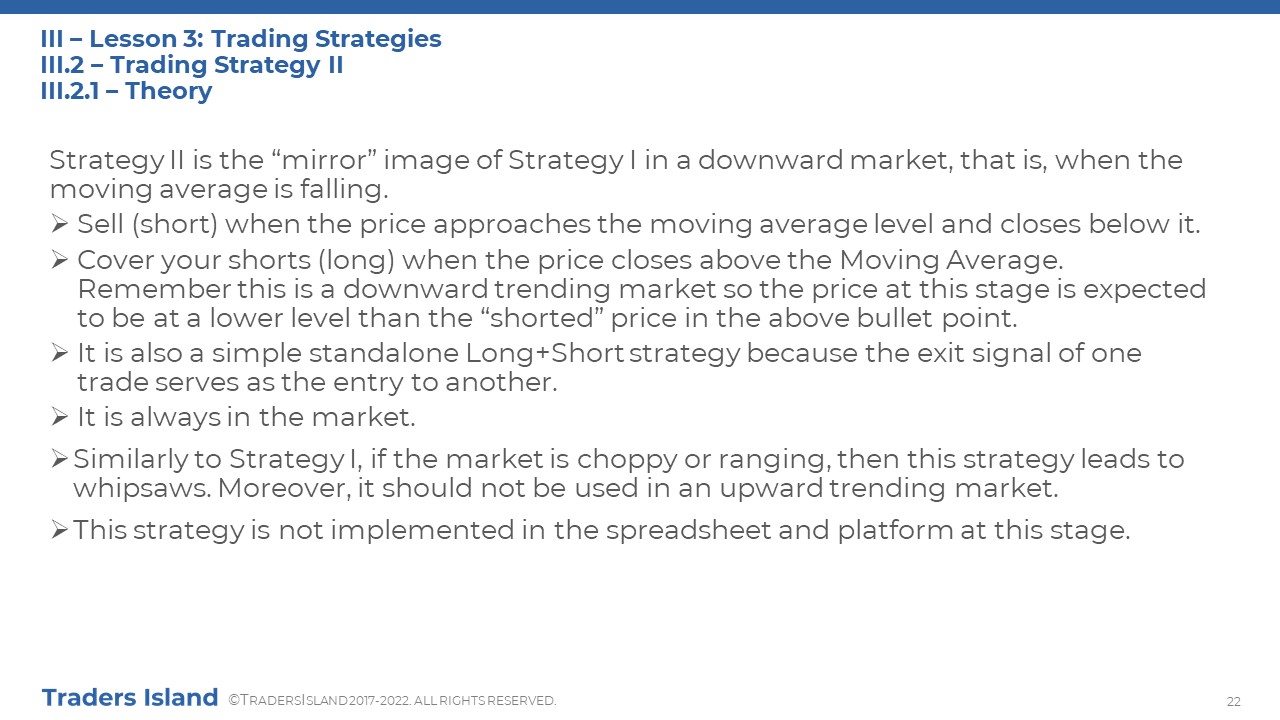
III.2 - Trading Strategy II
This is the mirror image of strategy I albeit in a bear market. In brief, it gives a sell signal when the price crosses below the moving average and a buy signal when it closes above the moving average. It is also quite sensitive to the length of the lookback period. Slides 22-24 explain this strategy and illustrate it with an example. It is also important here to bear in mind that this strategy does not hold in every market. Slides 37-38 explain how you can get “whipsawed” if you use a moving average strategy when you are not supposed to.
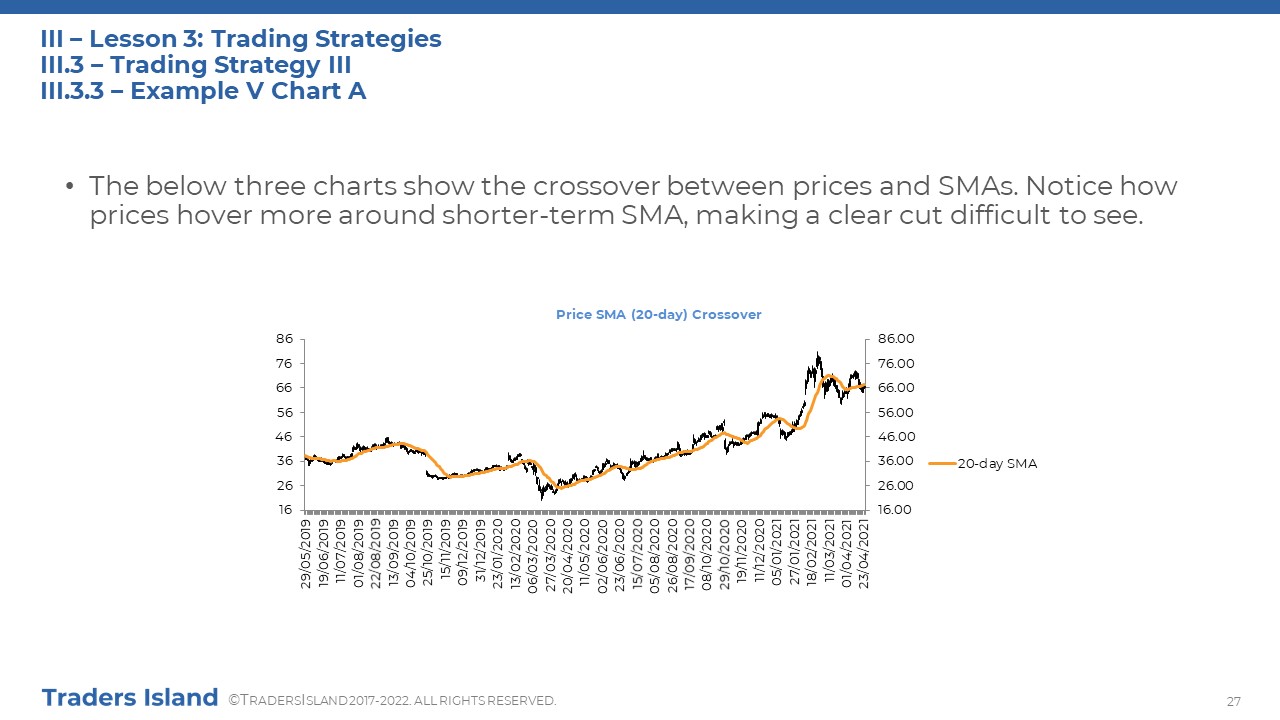
III.3 - Trading Strategy III
This is a more sophisticated strategy than the previous two strategies. It does help you avoid whipsaws though as it gives trading signals based on the crossover of two or more moving averages with different time periods. Slides 25-30 delve deeper into this strategy.
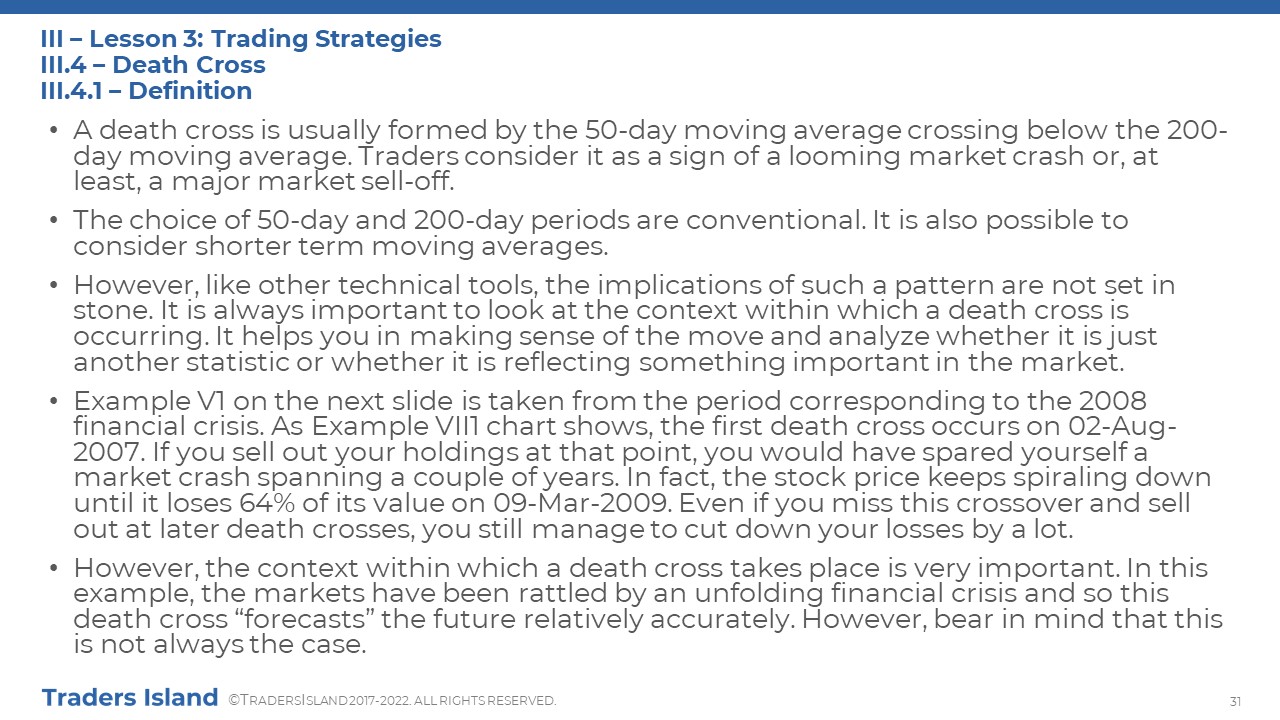
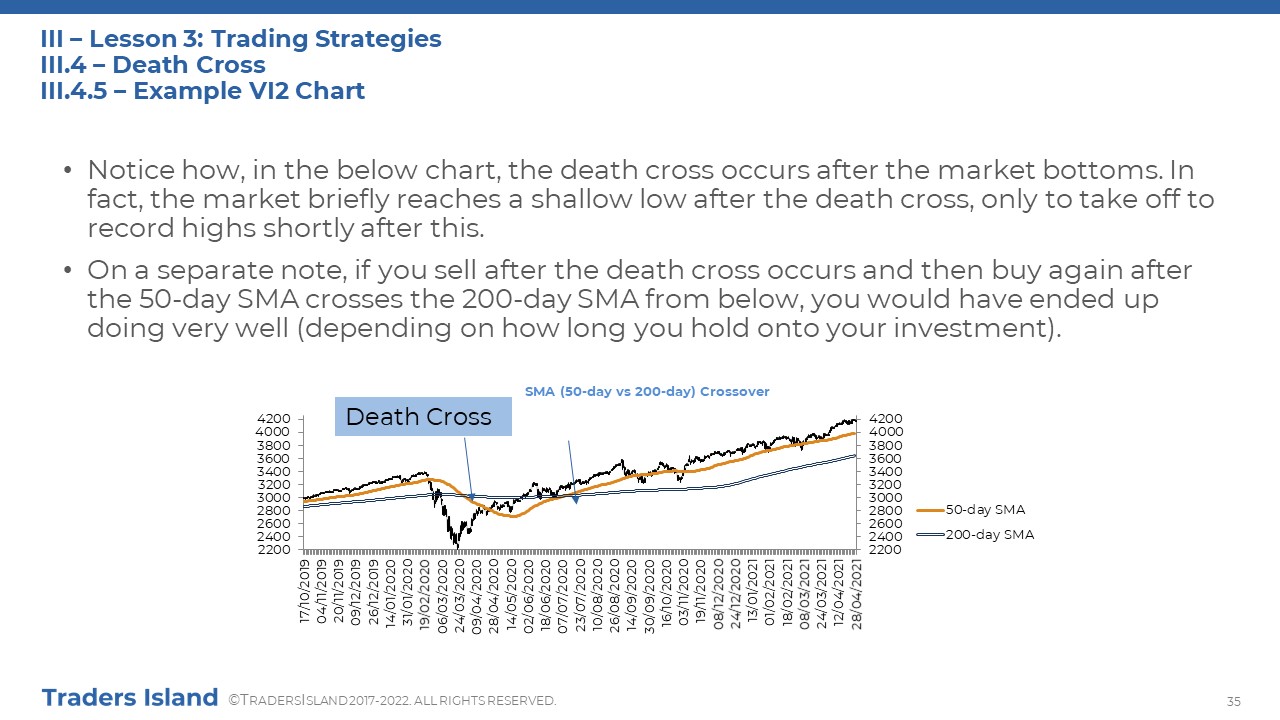
III.4 - Death Cross
You may have come across this term, not just in the stock market but also in the commodities and foreign exchange markets. It is a key concept in technical trading that traders keep an eye on, especially during bearish times. “Death Cross” is related to Trading Strategy III. In a nutshell, it is a chart pattern based on a moving average crossover that is perceived as spelling bad news for bulls. Conventionally, it represents the 50-day moving average crossing below the 200-day moving average. Slides 31-36 below explain the “Death Cross” in further detail whilst illustrating it with real world examples.
IV - Lesson 4: Key Concepts
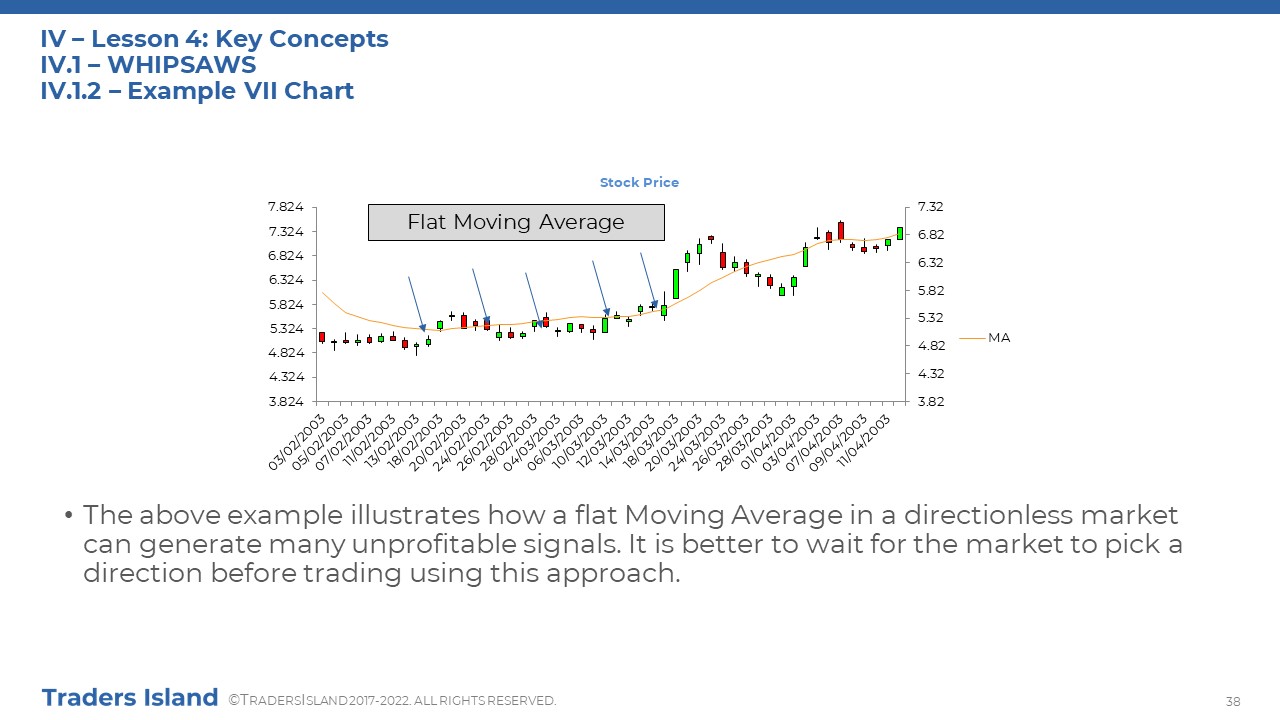
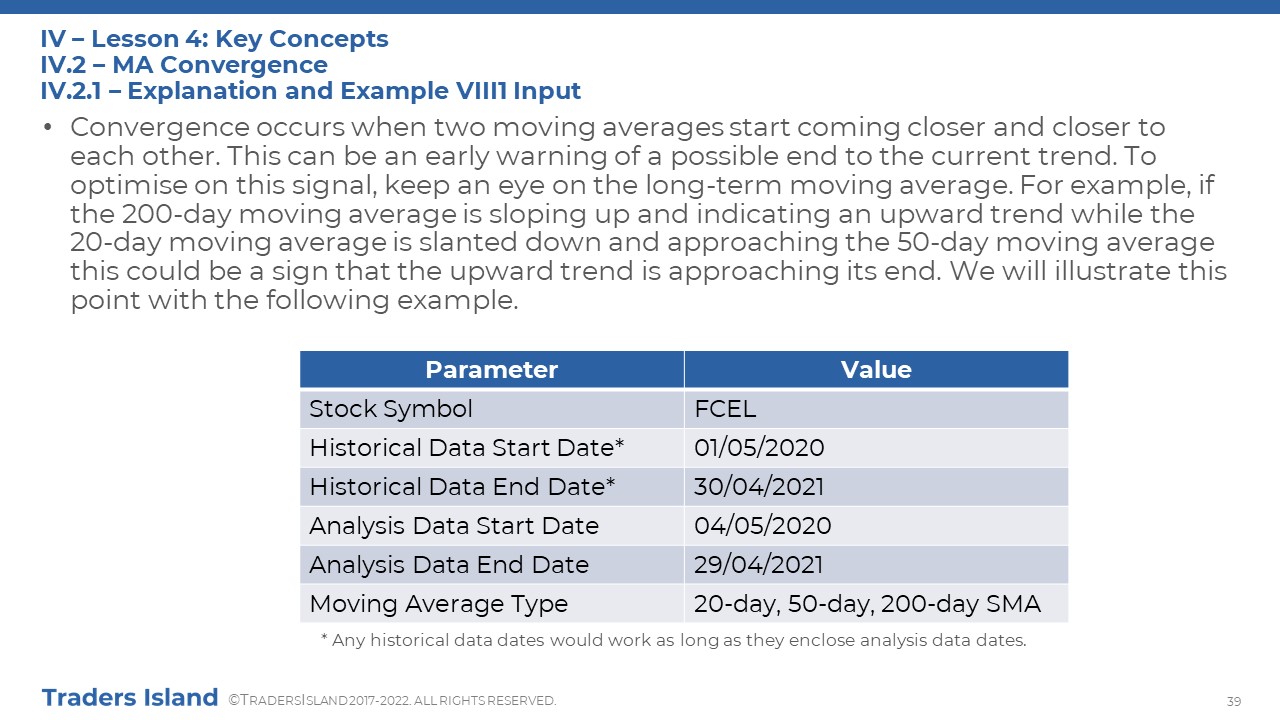
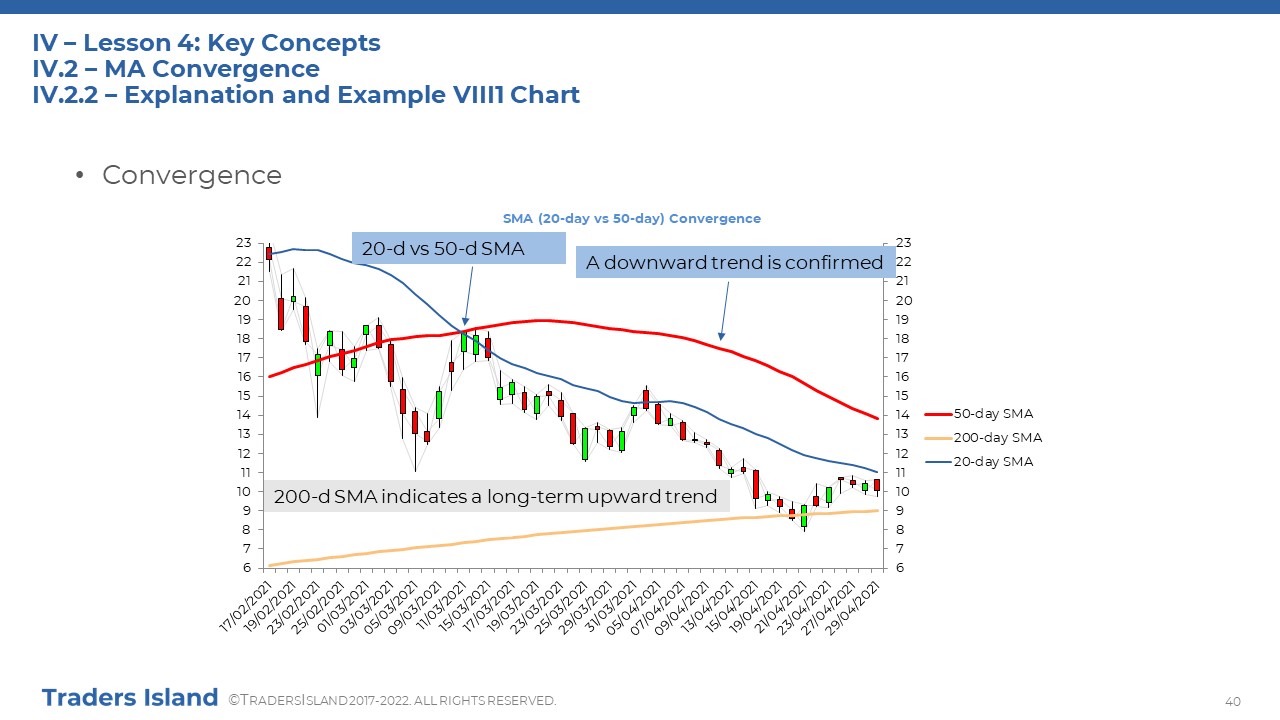
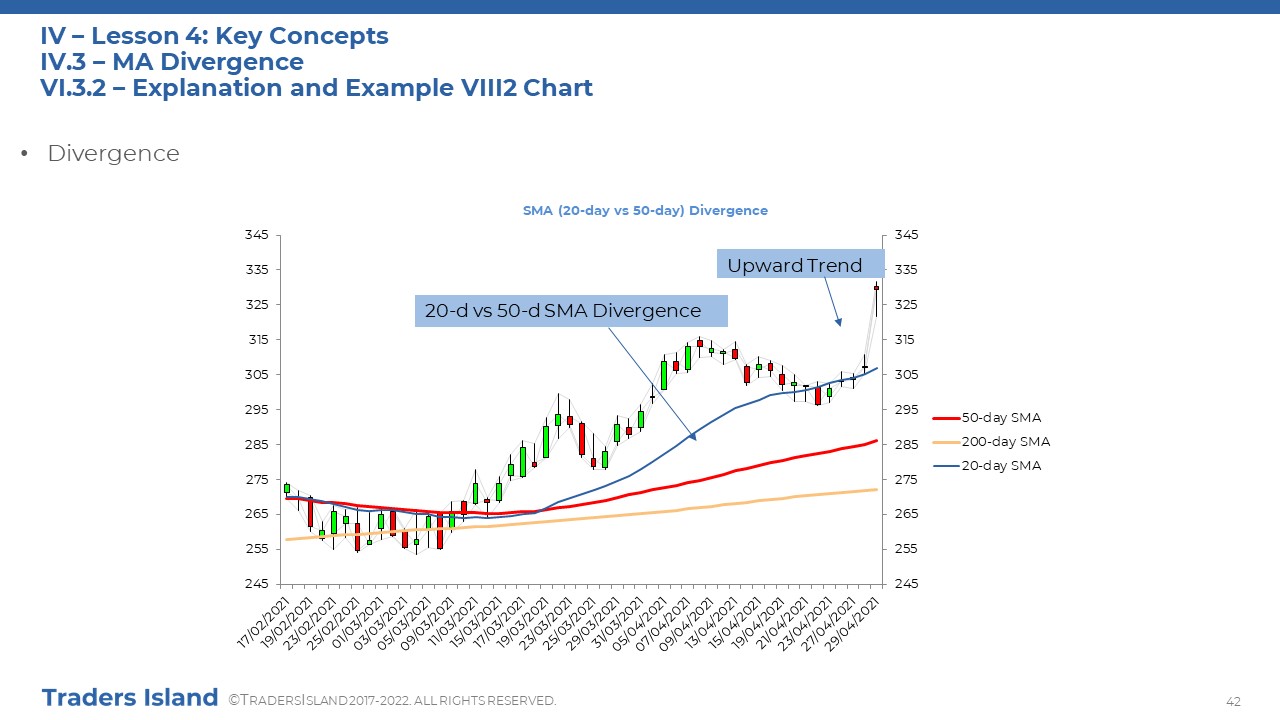
Before concluding the theory part of this tutorial, we take a short digression to discuss key concepts in trading that we have touched upon briefly under trading strategies above. We will talk about whipsaws, moving average (MA) convergence and moving average (MA) divergence, which can be found in slides 37-42. We have mentioned the term "whipsaw" several times above, under choice of period length and trading strategies I and II; whipsaws occur when the price changes direction around the moving average suddenly and sharply leading to mixed trading signals. Slides 37-38 explain whipsaws with an example. Moving average convergence (MA Convergence), which indicates two moving averages moving closer to each other, and moving average divergence (MA Divergence), which represents moving averages moving away from each other are two concepts that are closely related to the above Trading Strategy III. Slides 39-42 explain each concept separately with examples.

Theory Notes
In this section, you may explore the below slides to study lessons 1 to 4 material in more depth. This part covers the theory behind the moving average indicator. There will be two application parts incorporating study material or guides to the free web-based platform and the downloadable spreadsheet in the next two sections. (Authored by Dr Jolnar Assi)


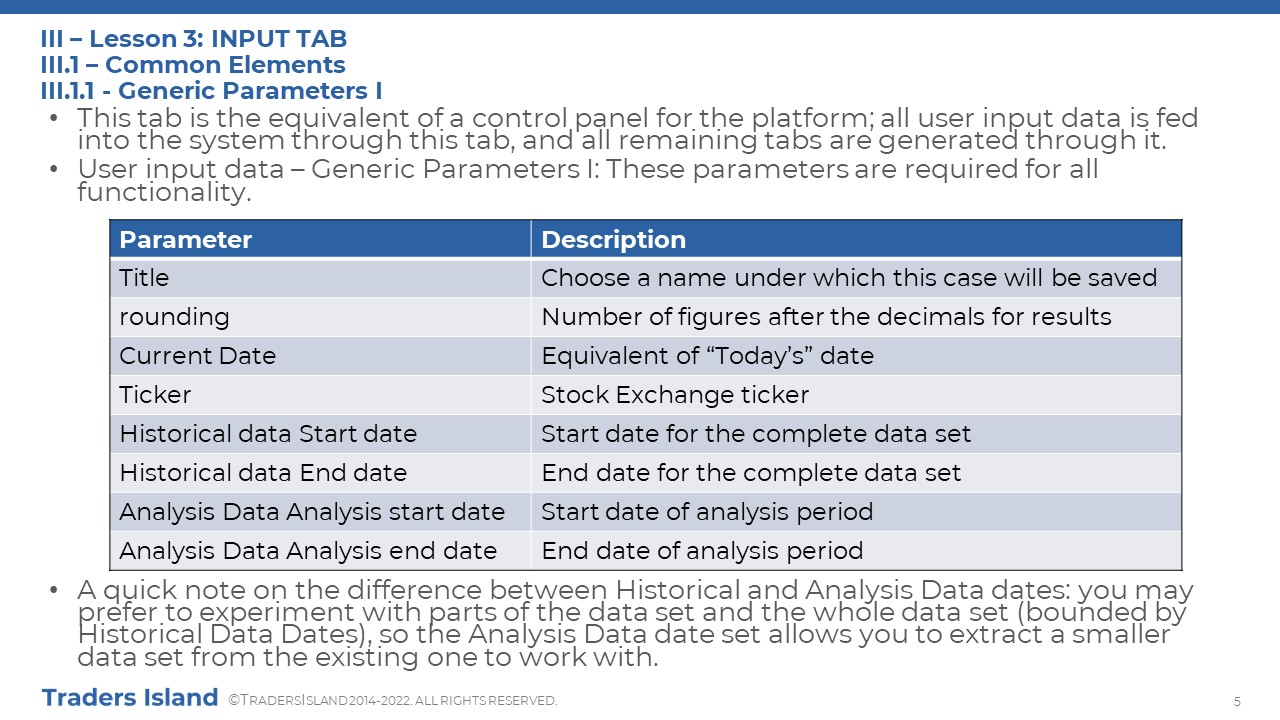
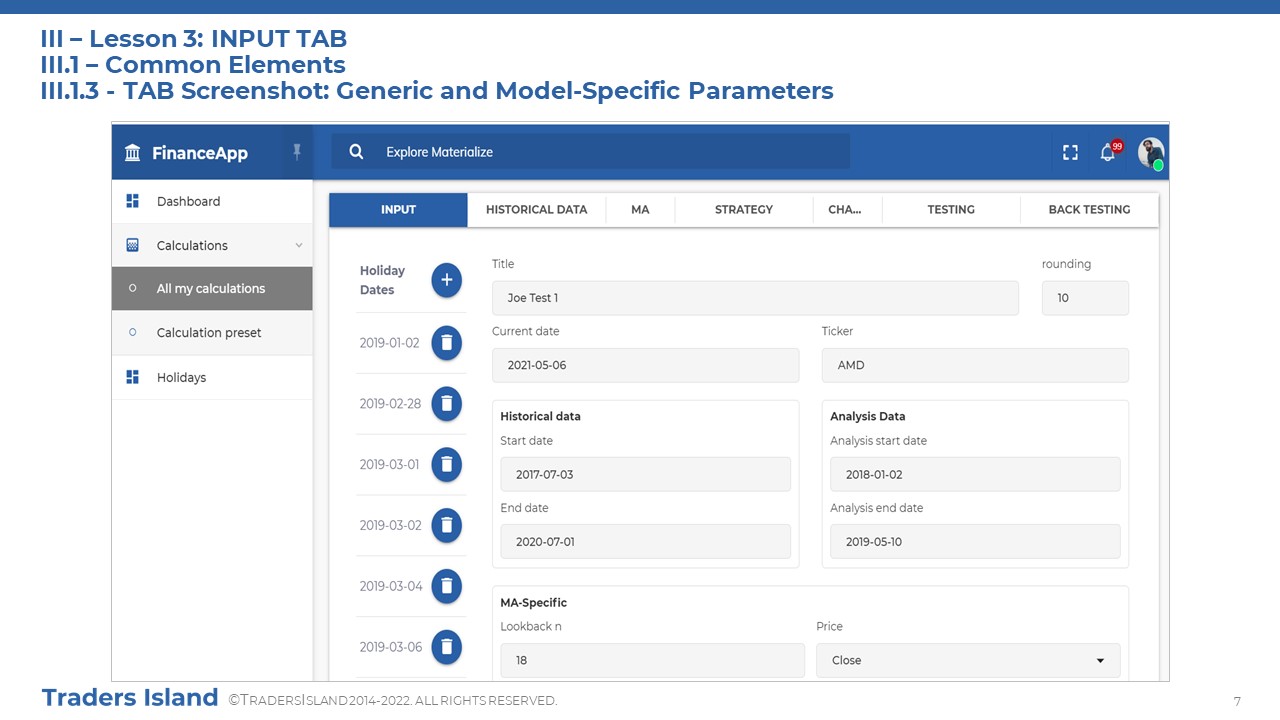
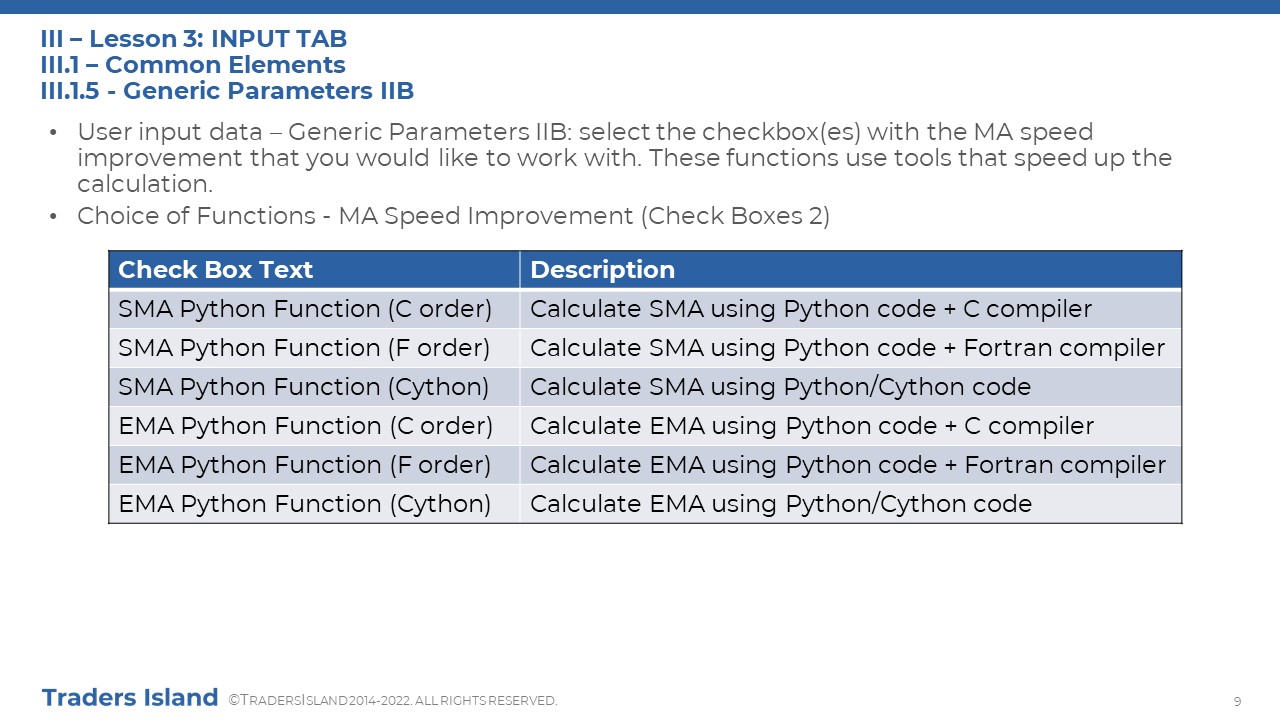
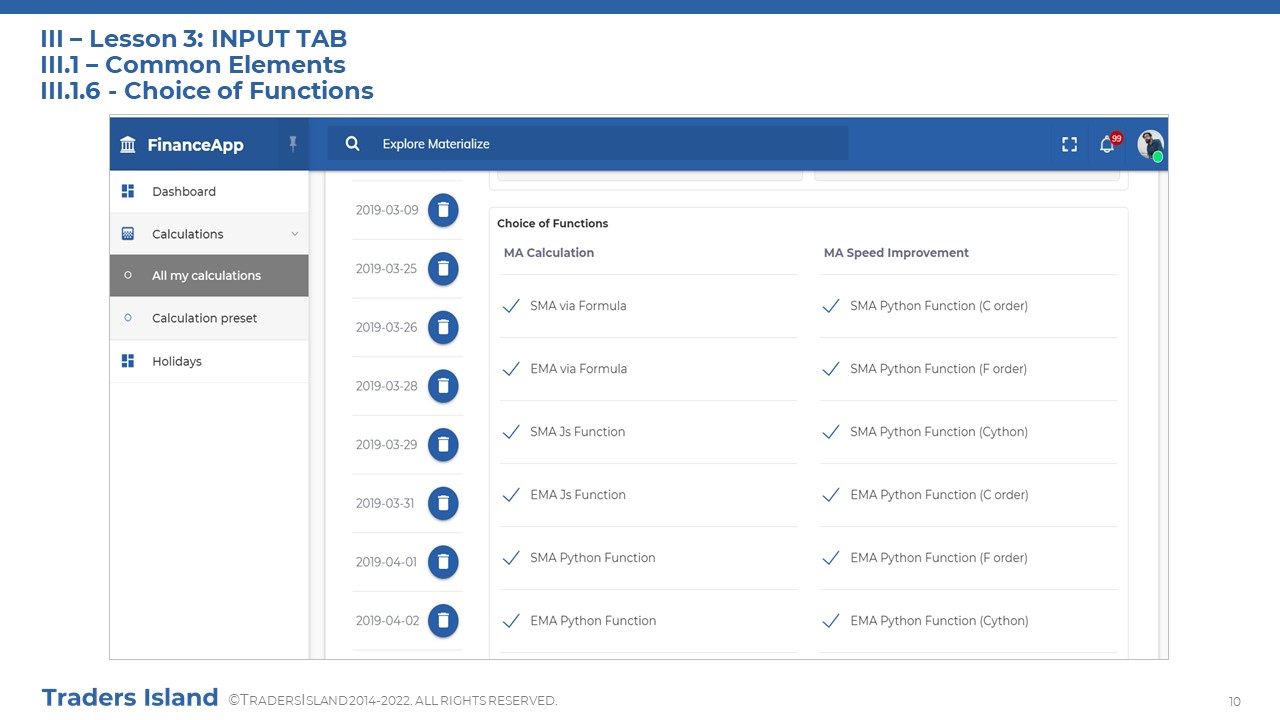
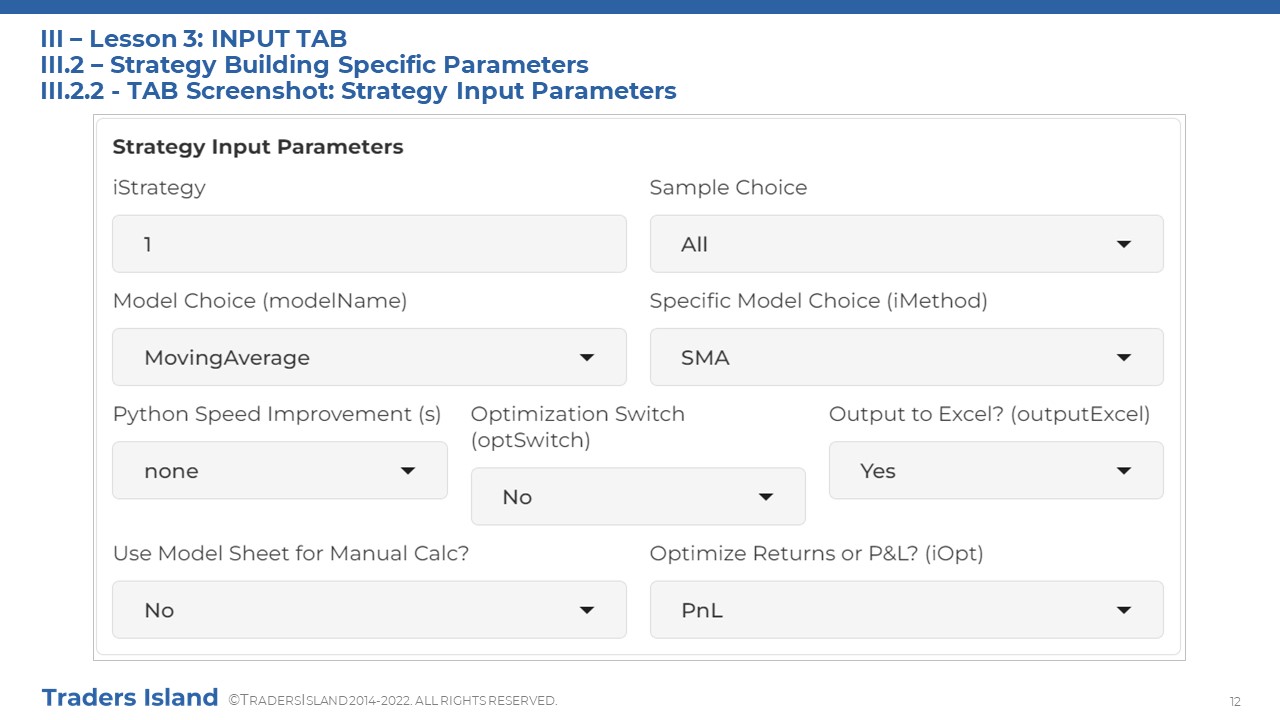
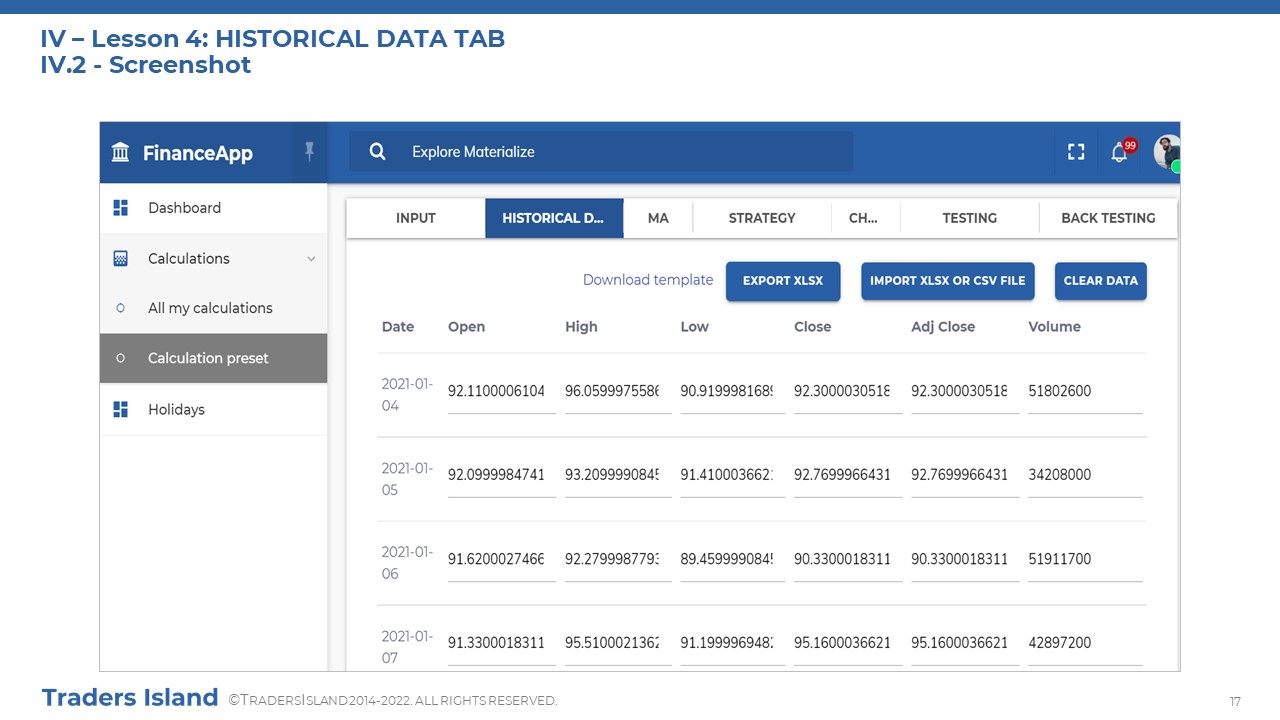
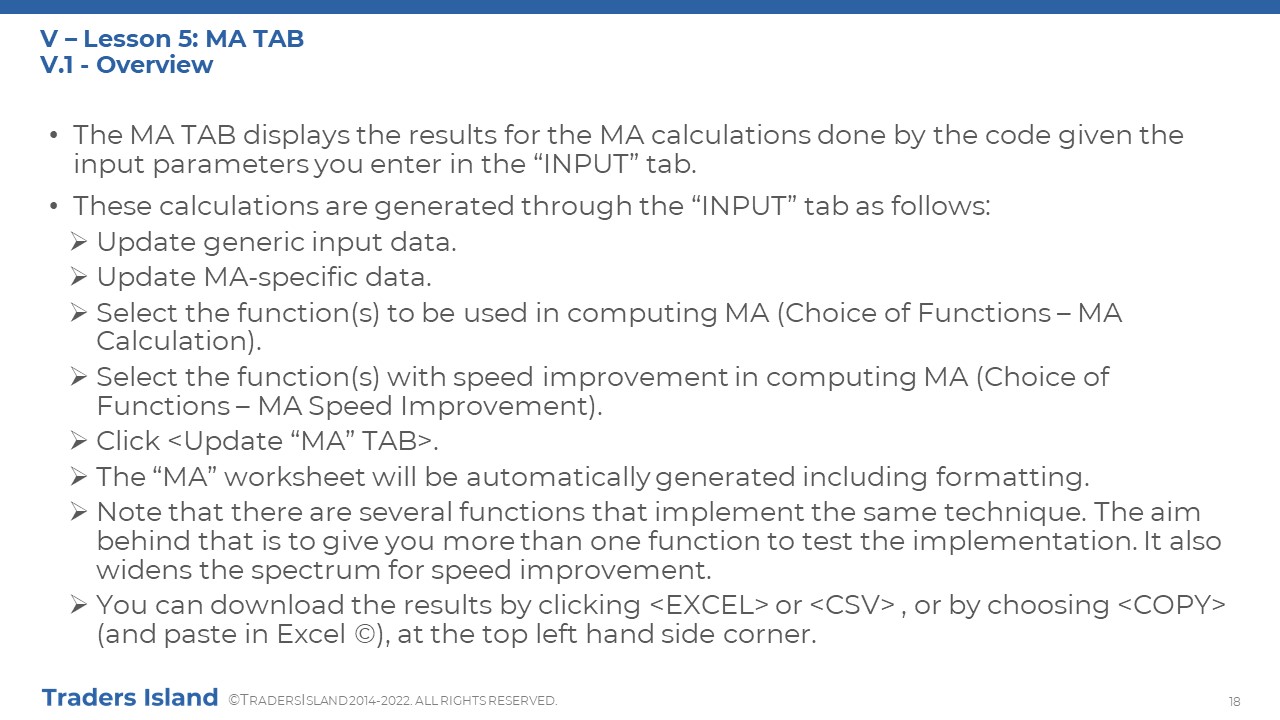
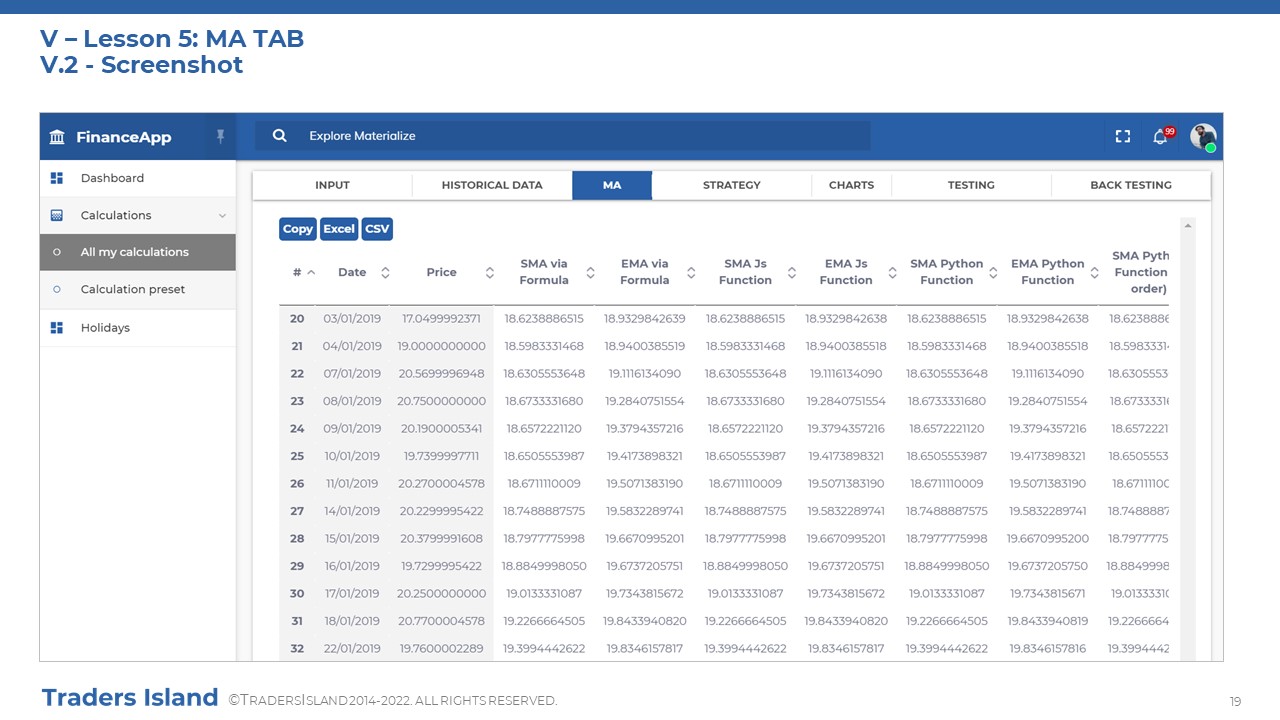
V - Lesson 5: Platform
We offer you a free web-based platform to explore the concepts you have learned above and their applications using real-world data. The platform is fully automated including data retrieval. You can experiment with different types of moving averages and lookback periods. You can also examine and analyse the outcome of Strategy I under different scenarios. The below platform notes explain how you can use the platform to apply what you have learned so far.

Platform Notes
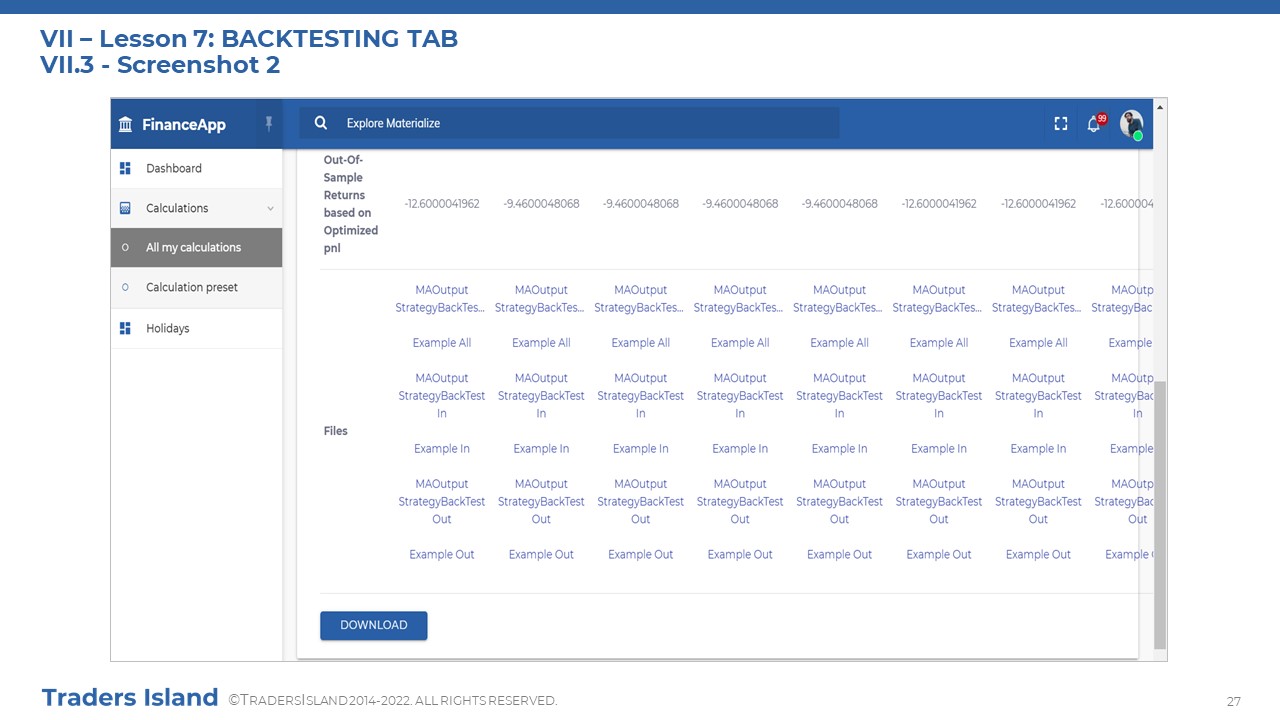
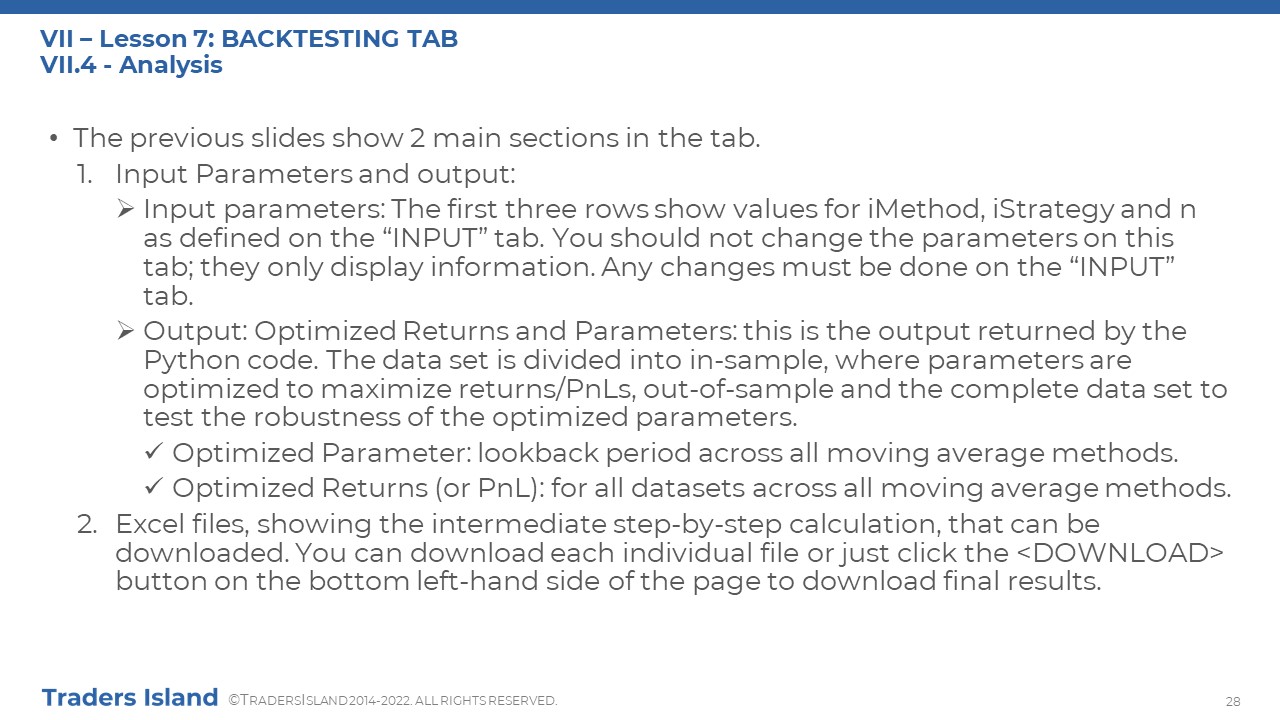
This section presents the material for lesson 5 in a slide format, which can be explored for free as well. You will also be able to download them in a pdf format. In brief, these slides form a mini-guide to the web-based platform, helping you to apply what you have learnt in the theory part for free.


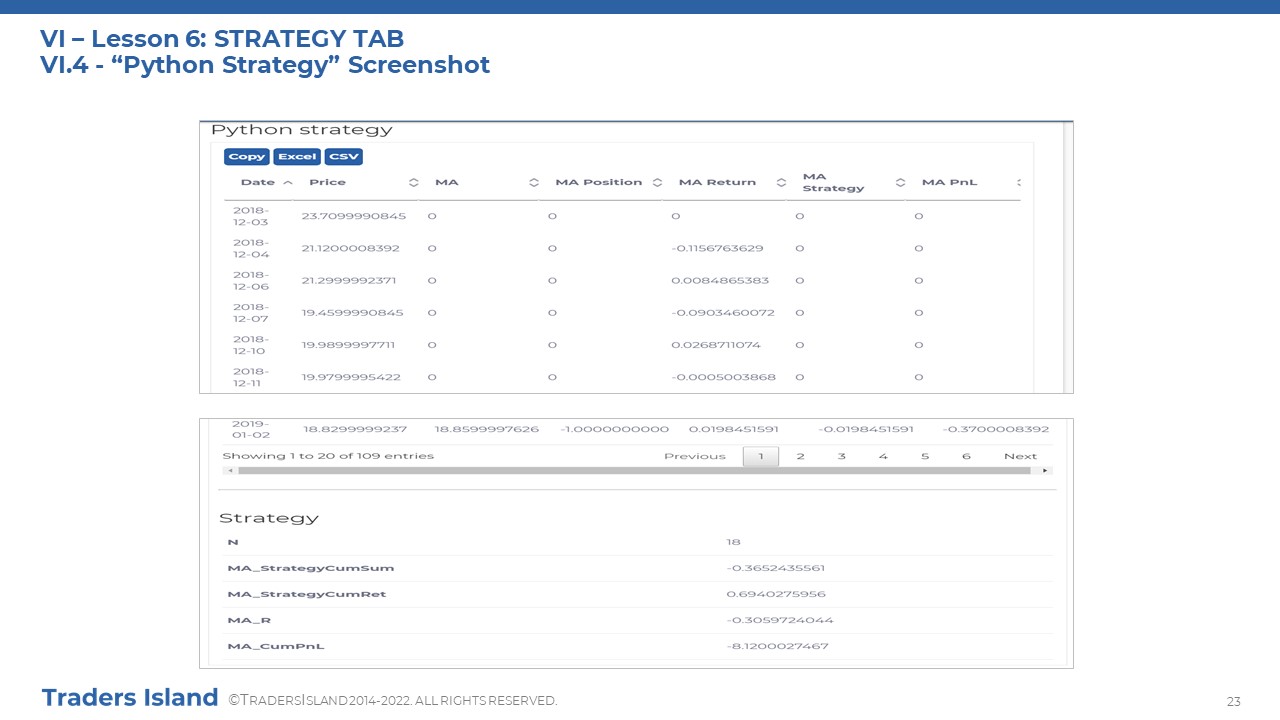
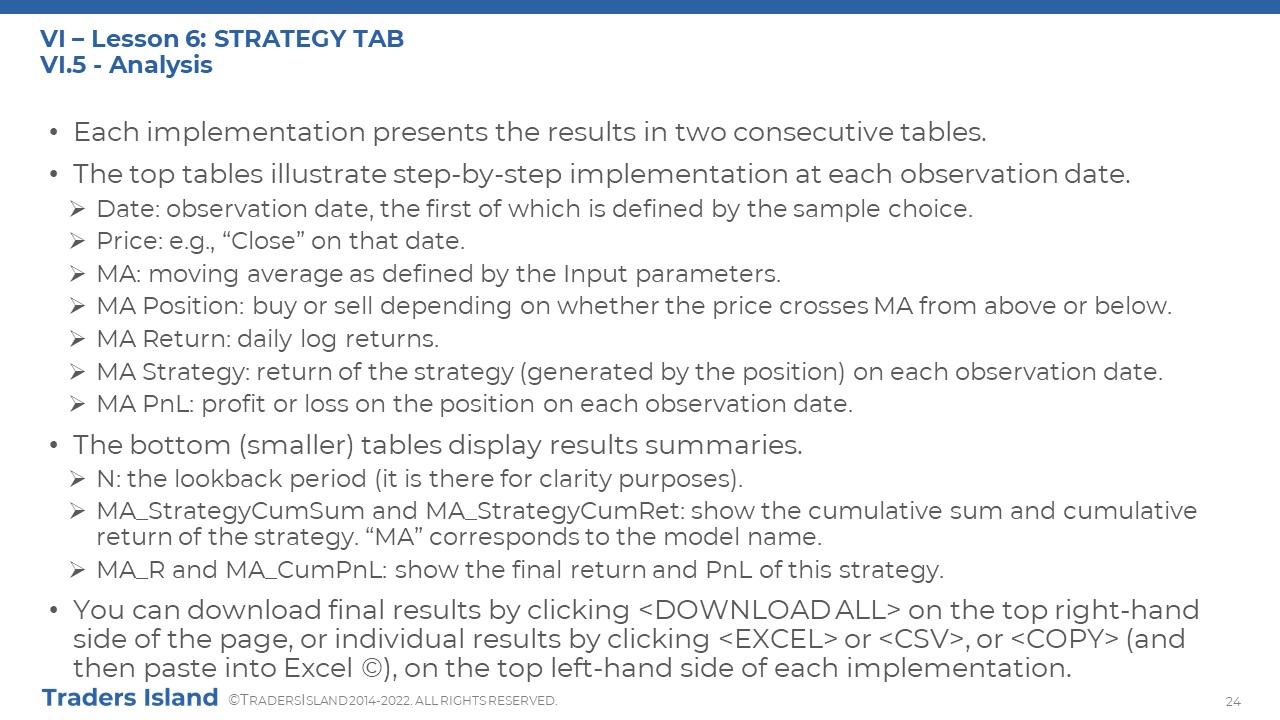
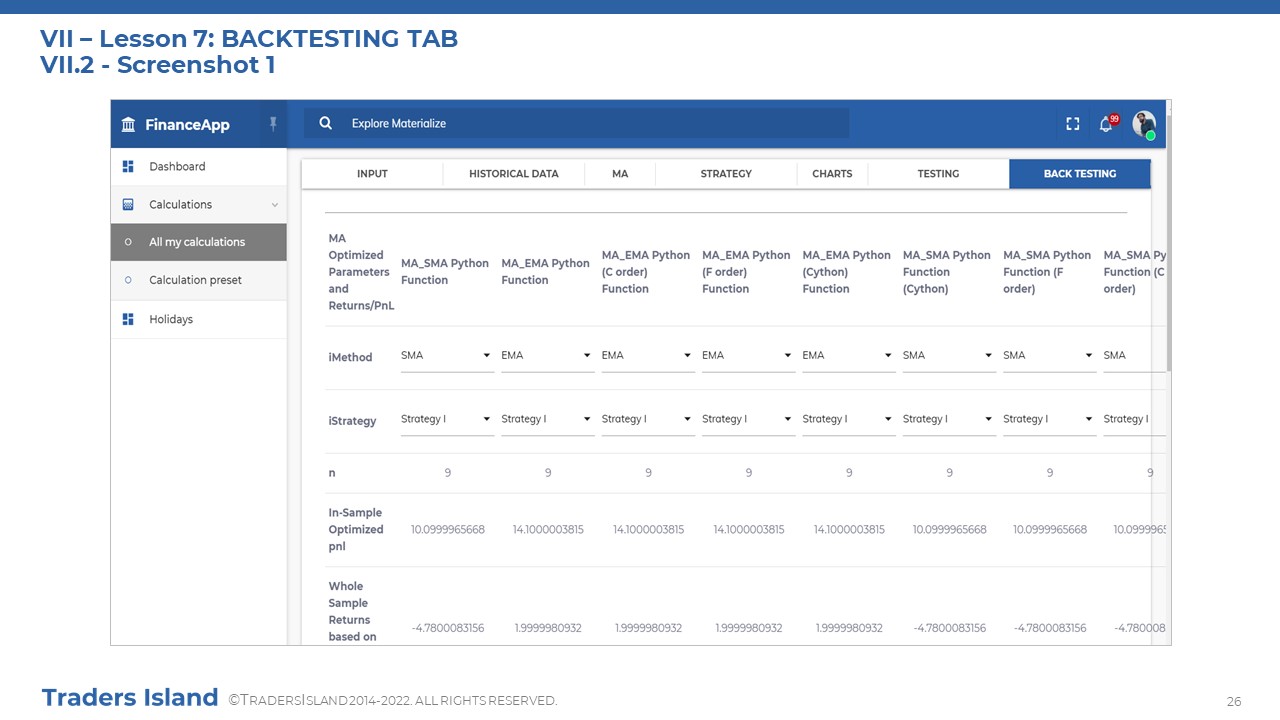


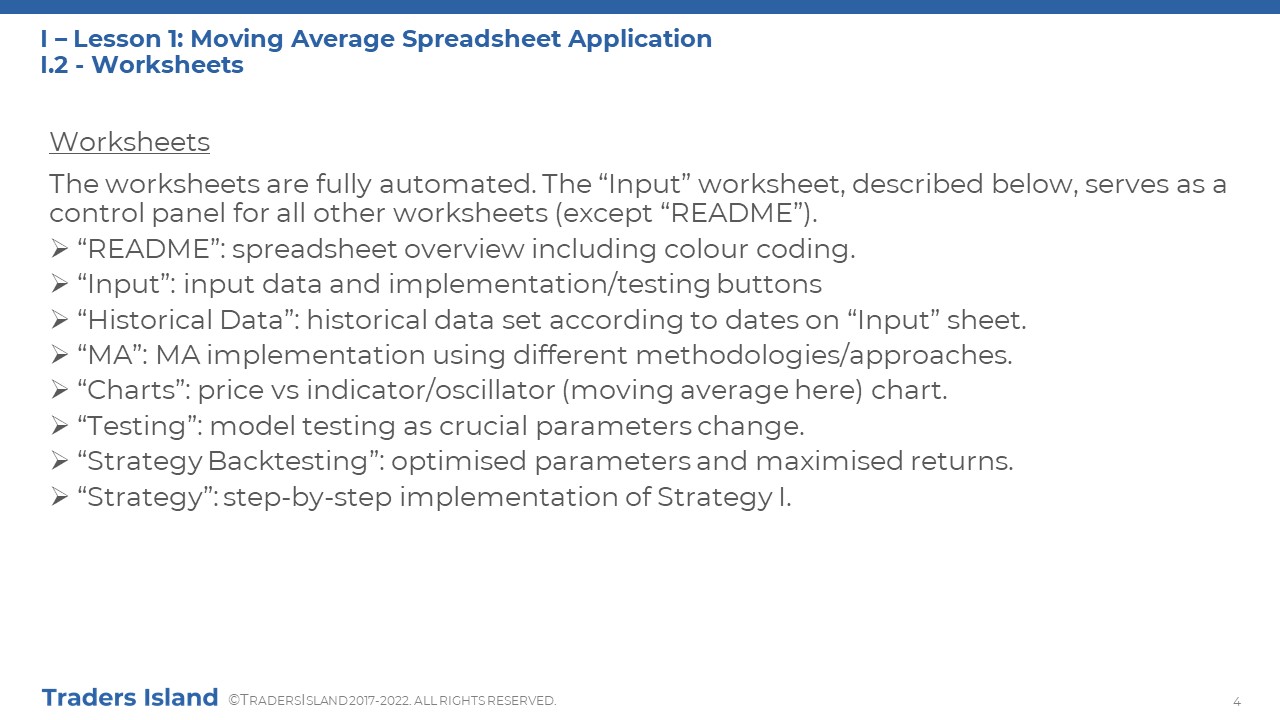
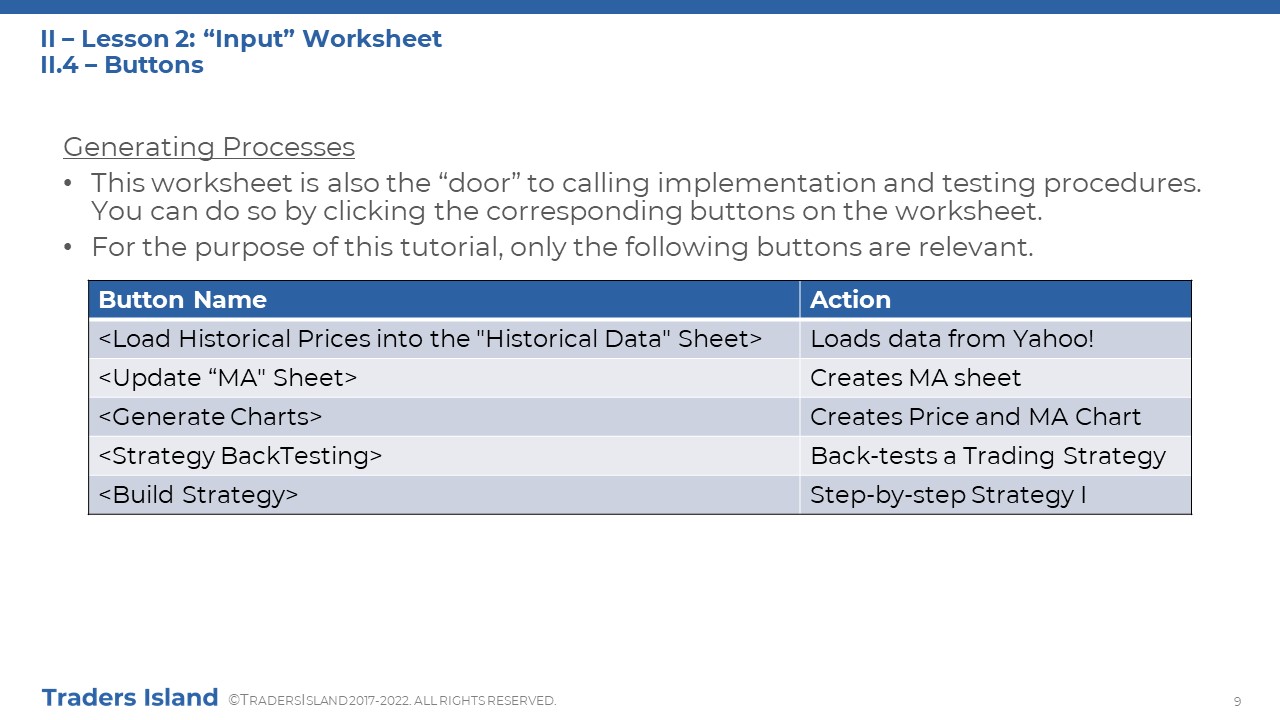
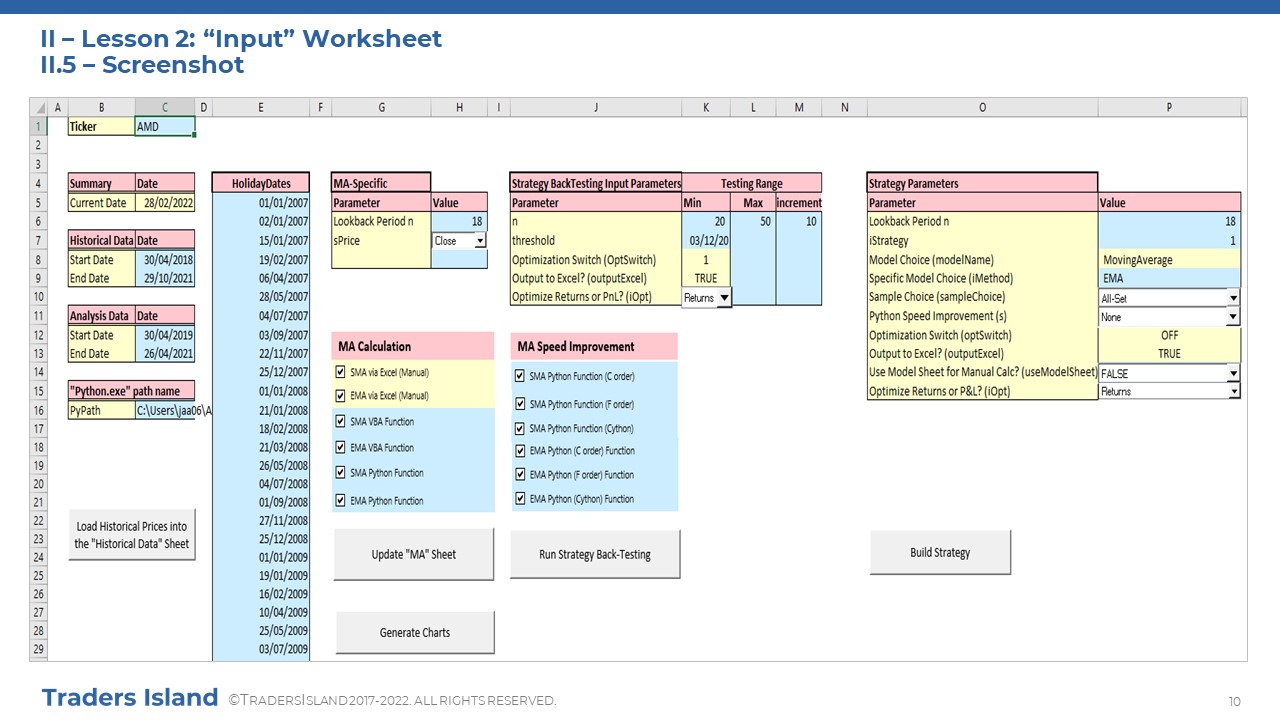
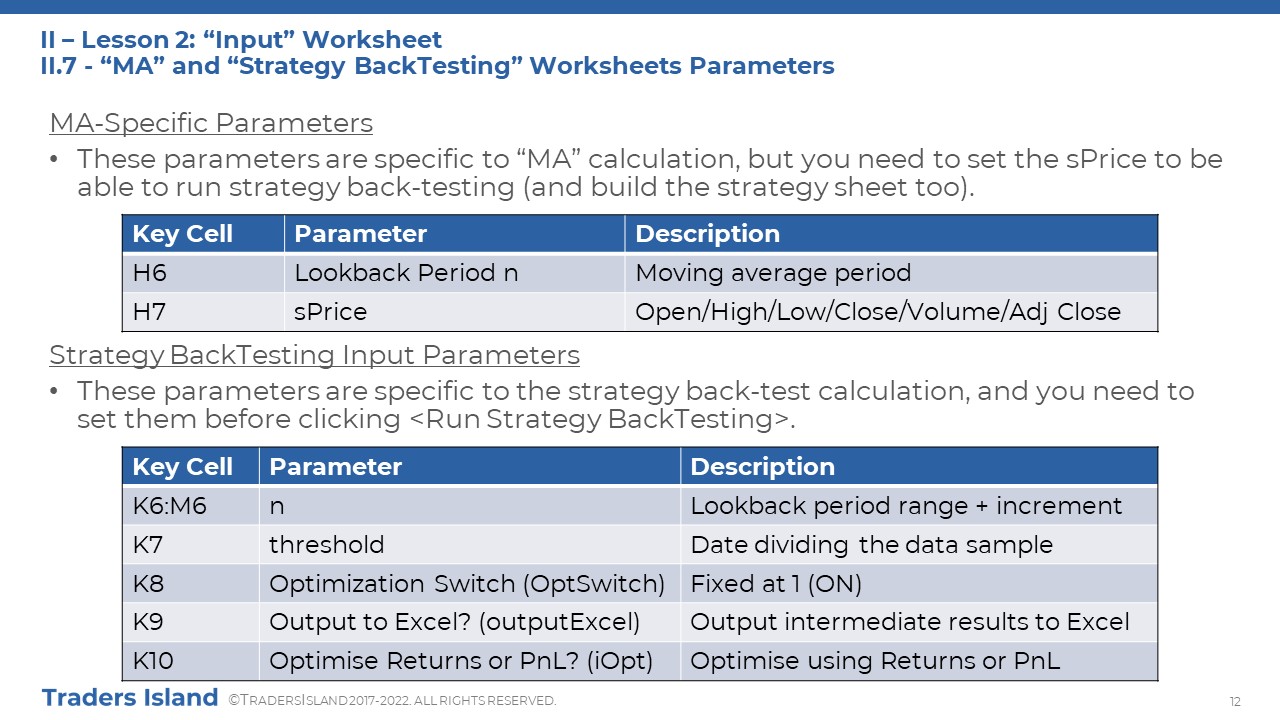
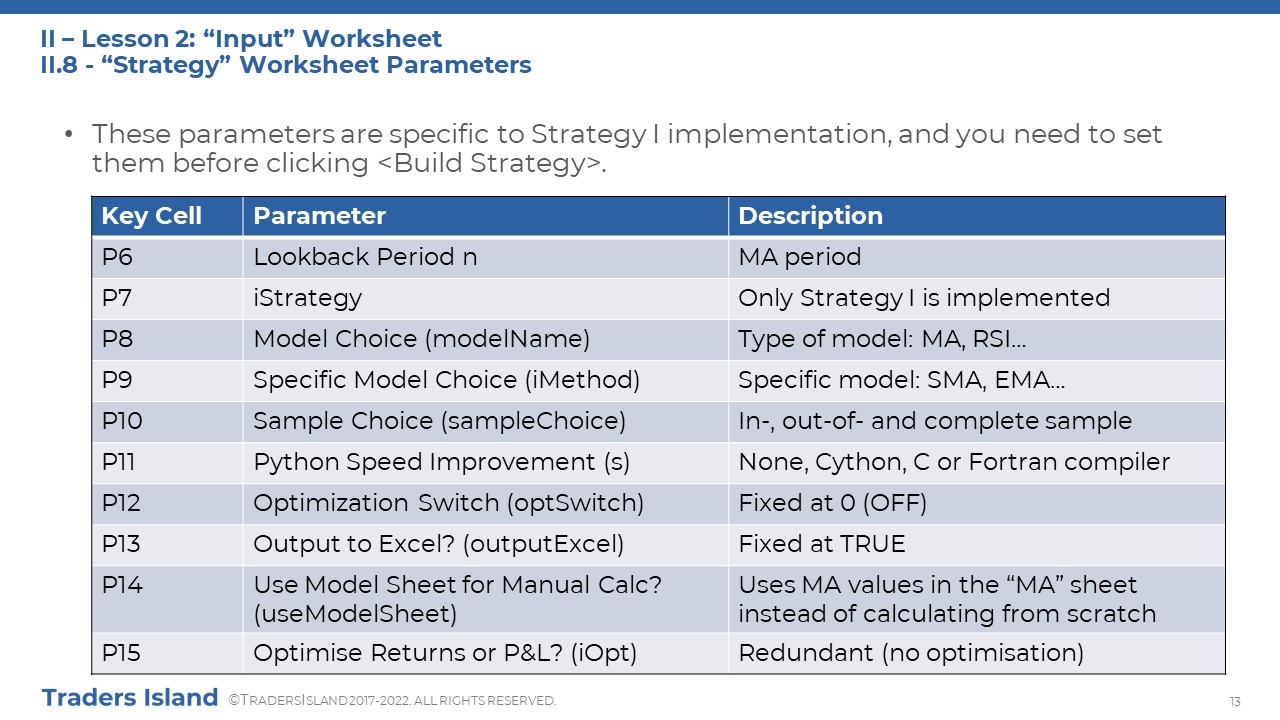
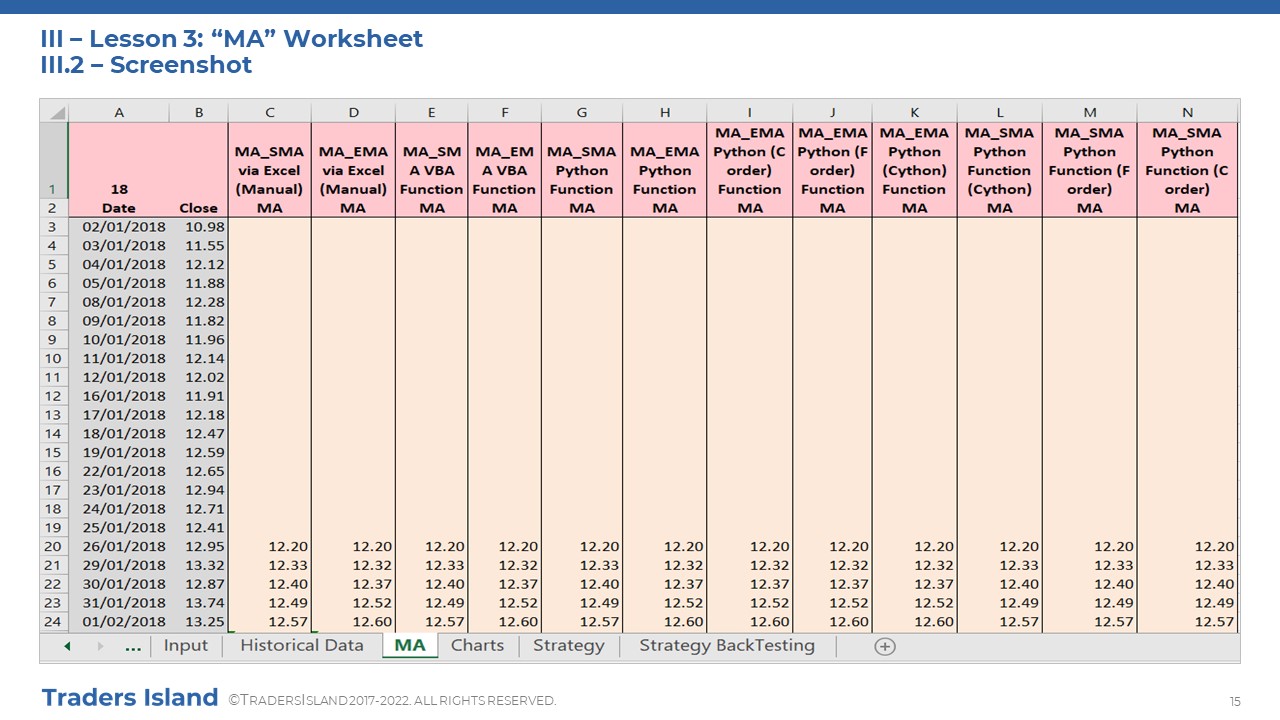
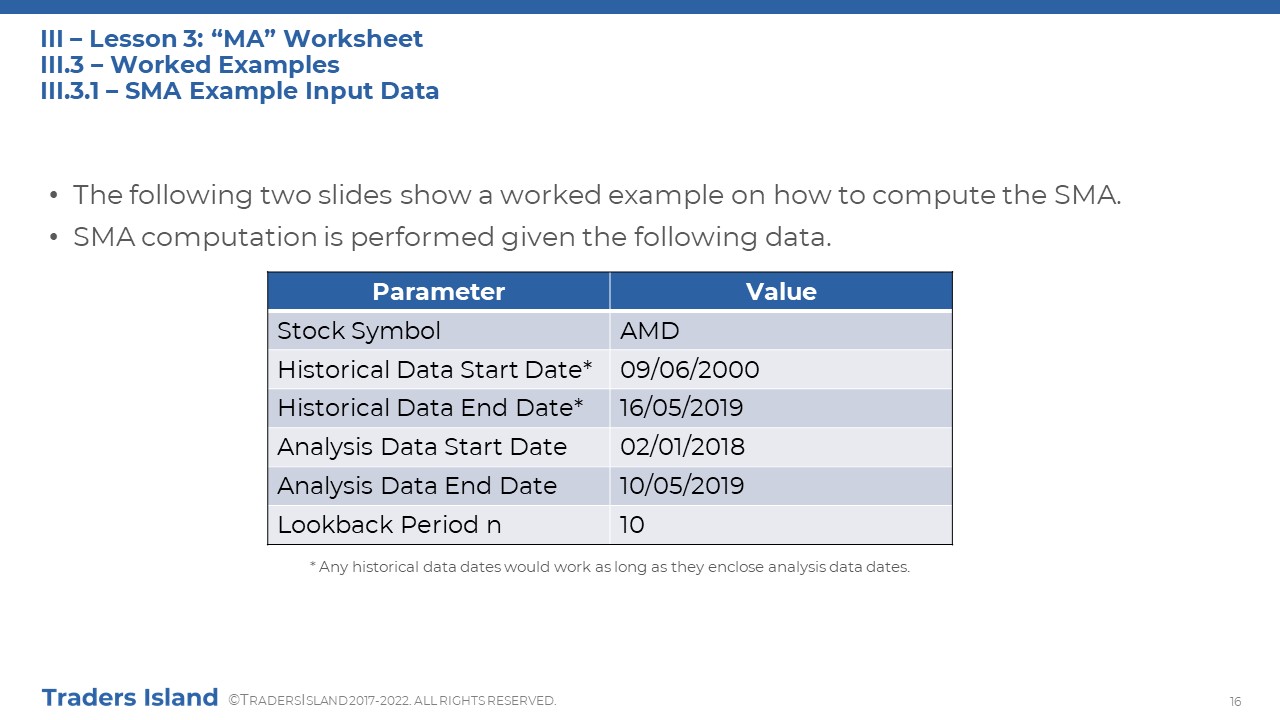
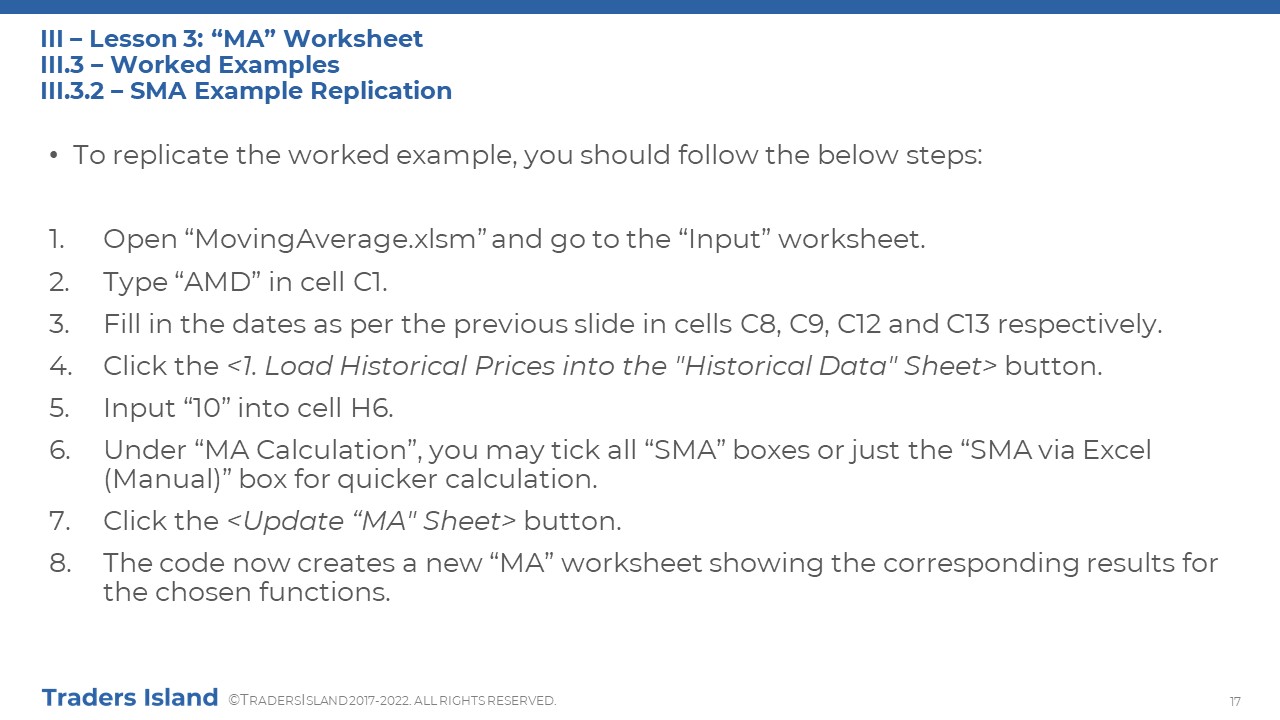
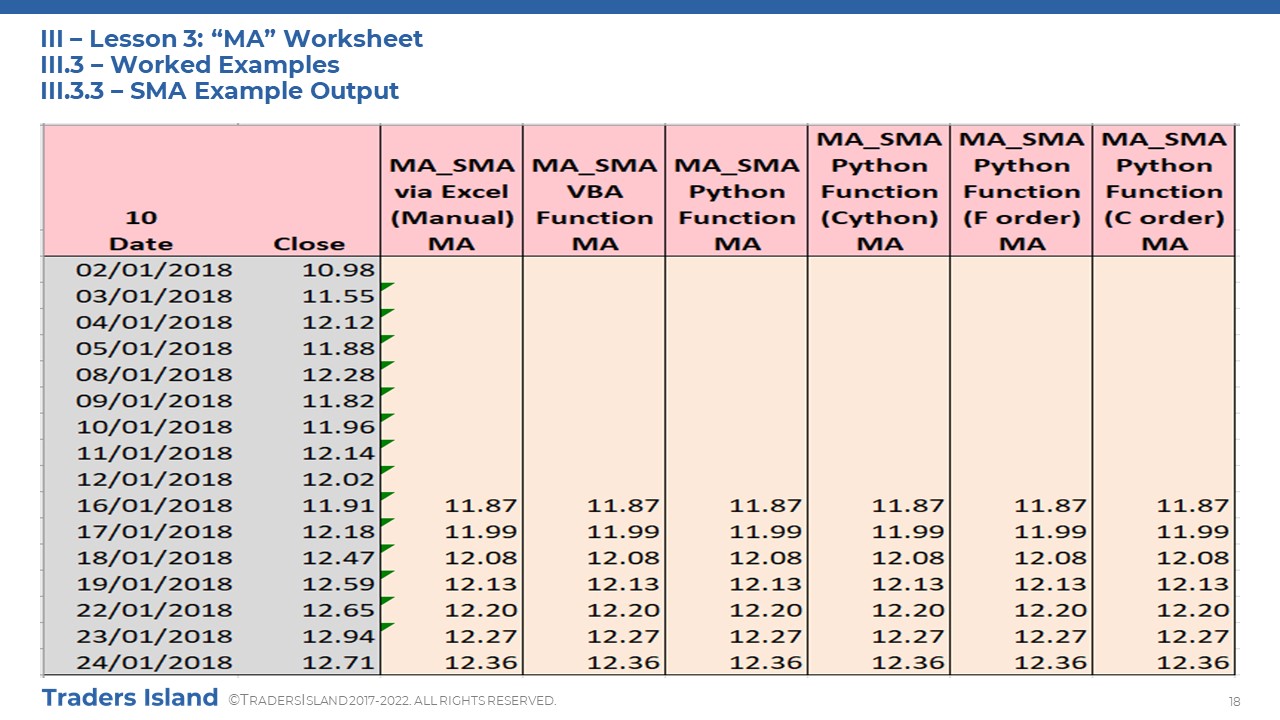
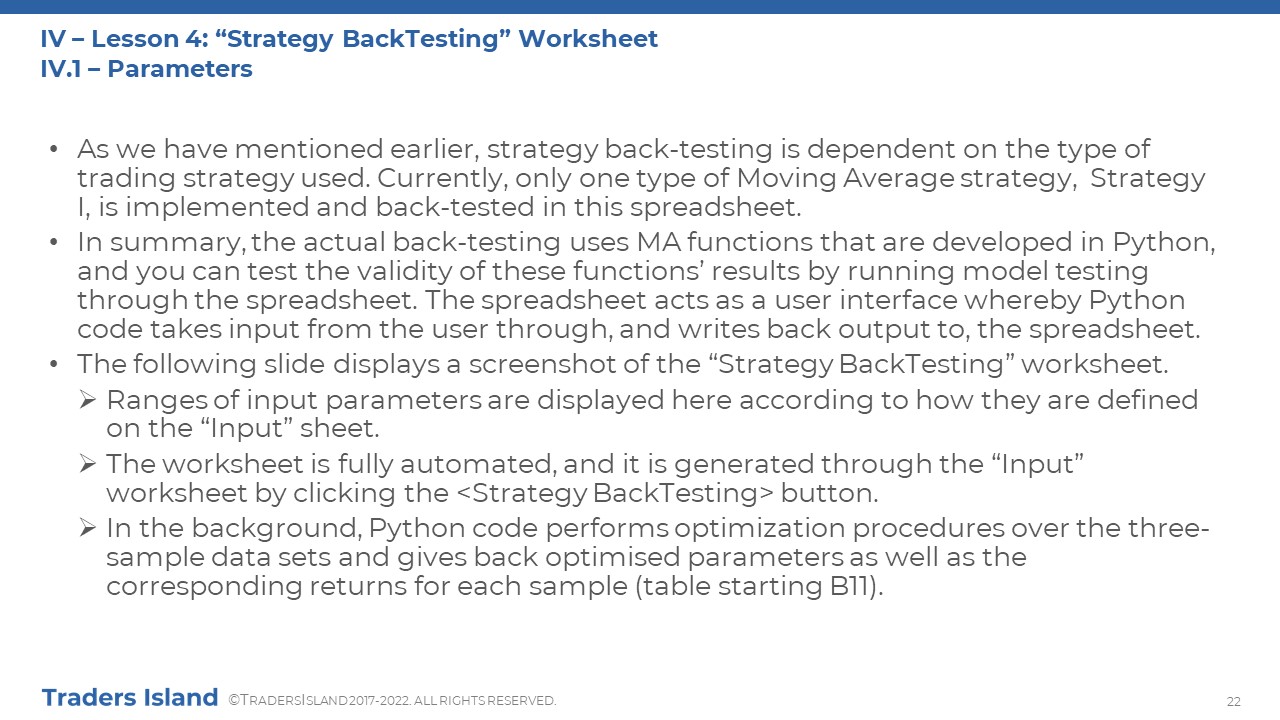
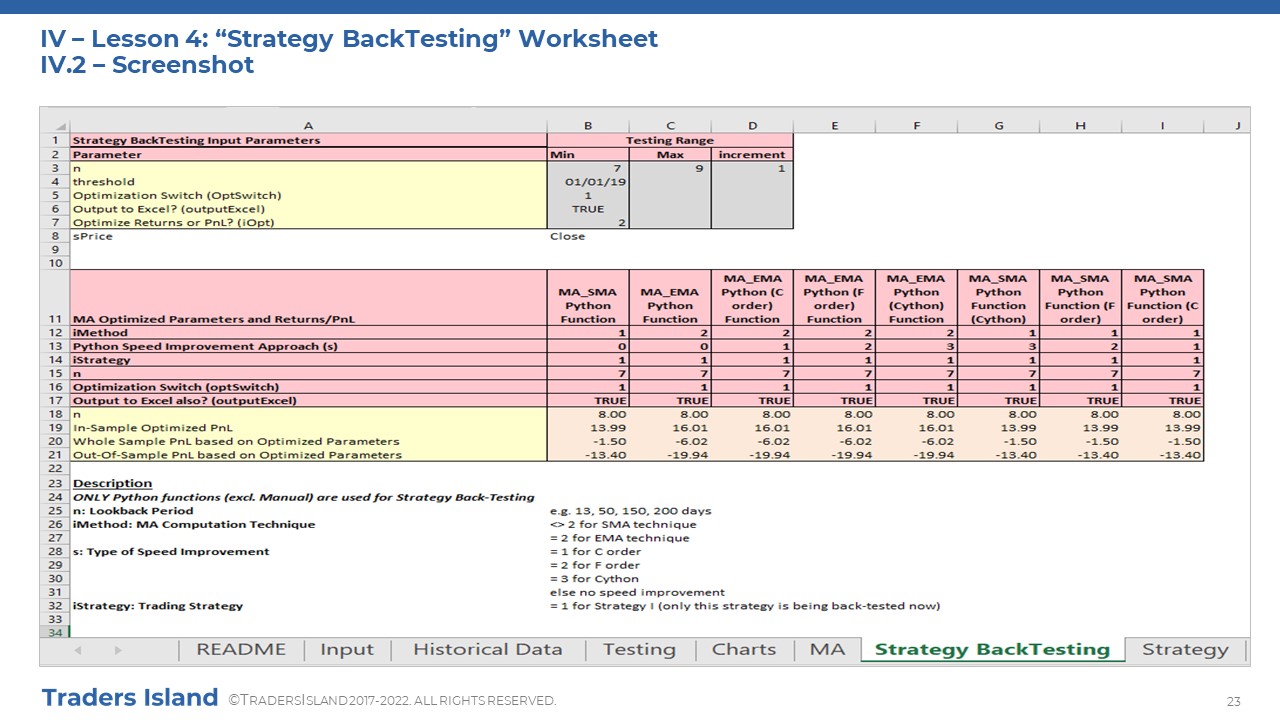
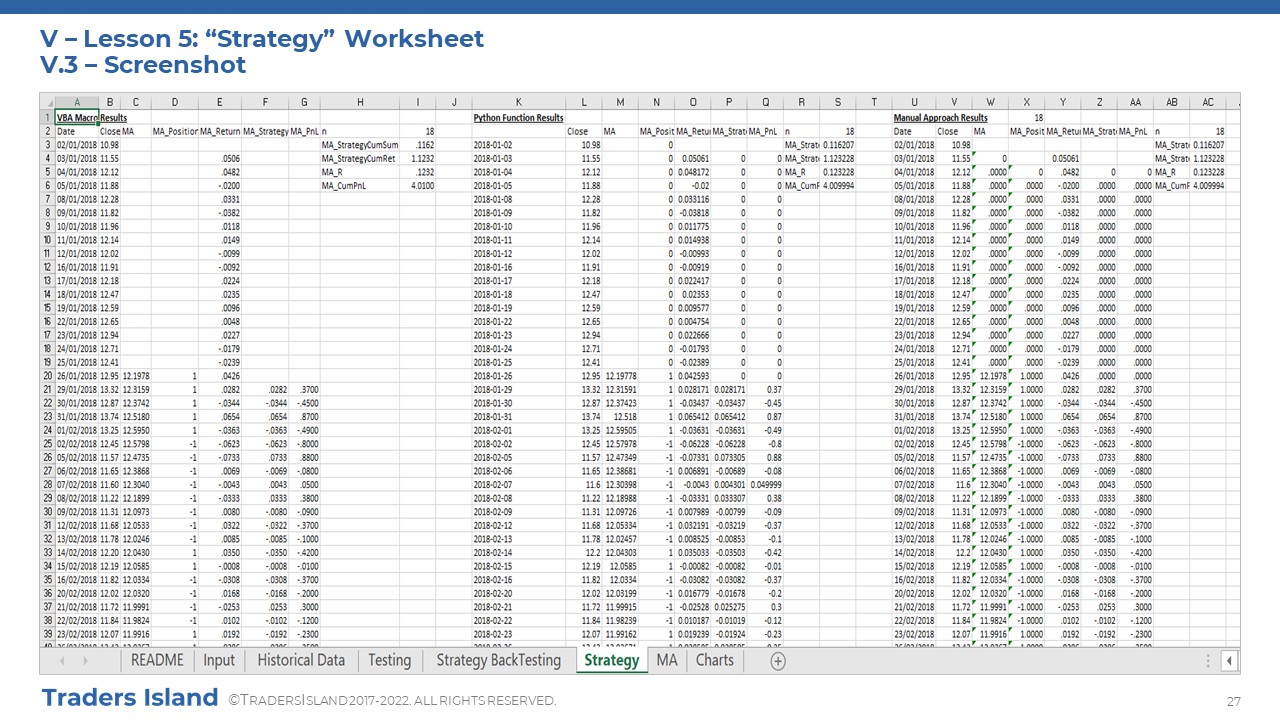
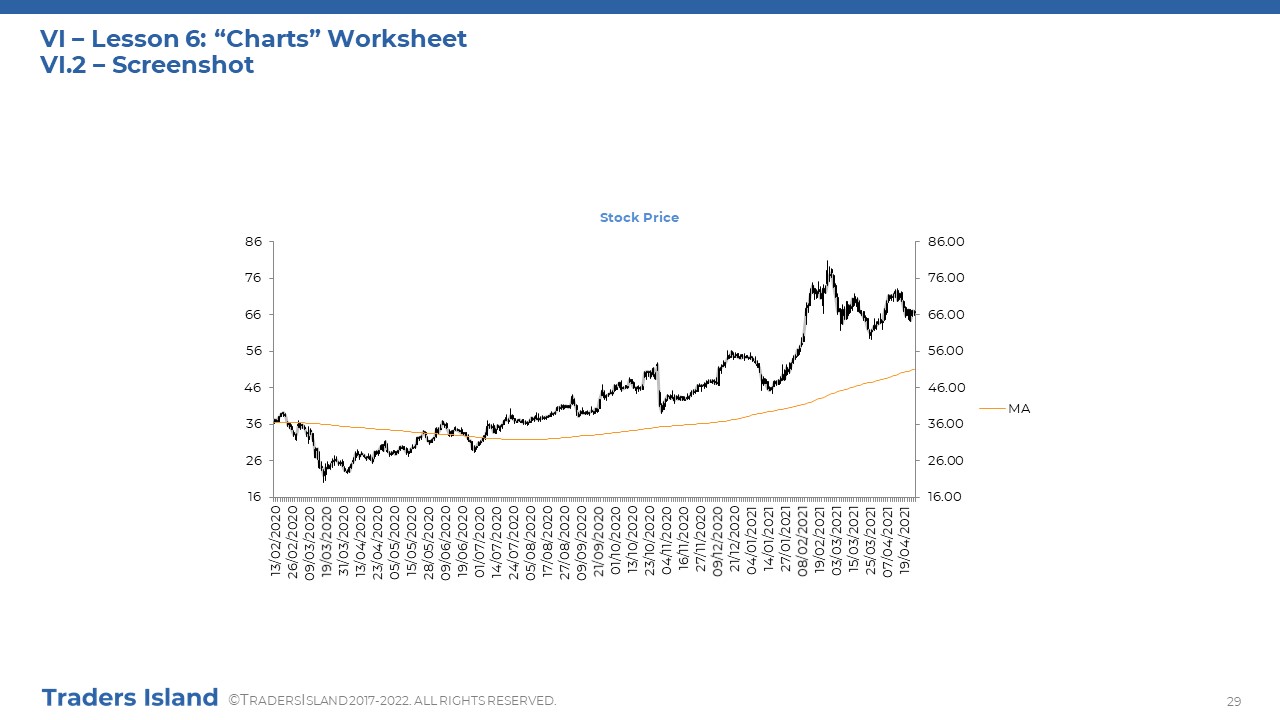
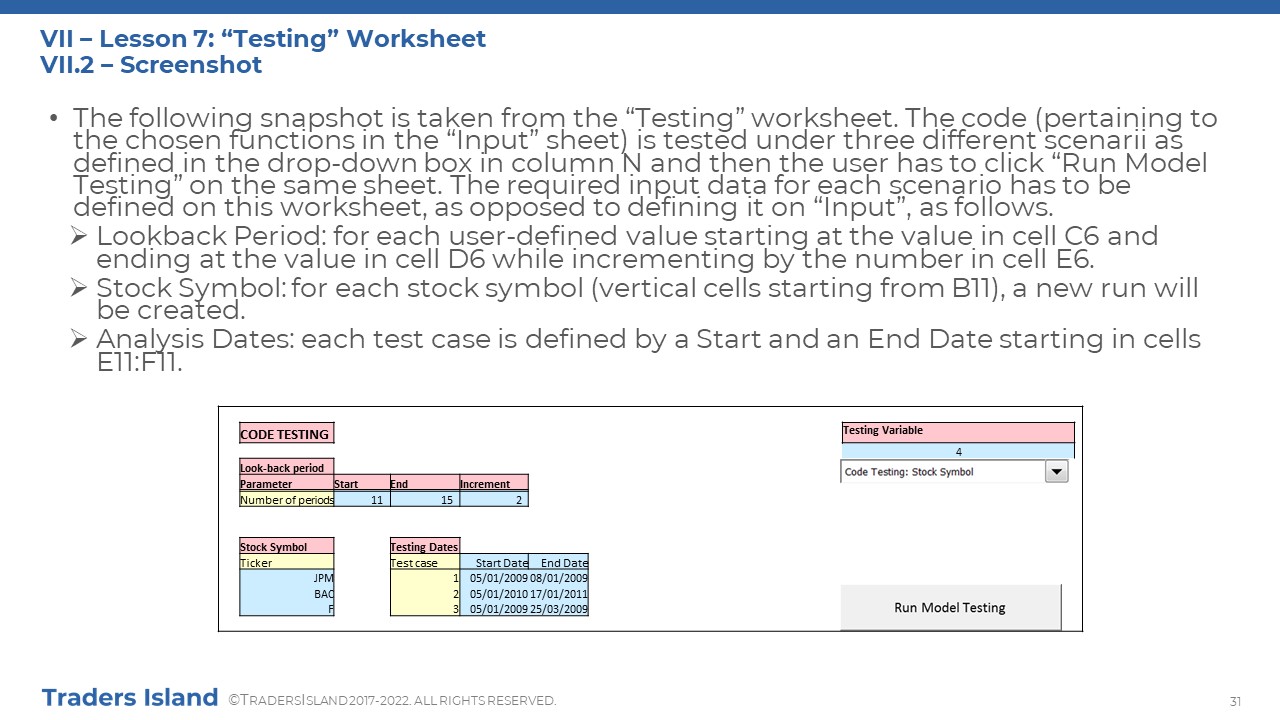
VI - Lesson 6: Spreadsheet
We also offer you a fee-based downloadable spreadsheet that has additional functionality to the platform’s and can be explored offline from your own desktop or laptop. It is also automated and allows you to explore the concepts that you have learned above. You can experiment with different types of moving averages and lookback periods. You can also test the code by changing specific parameters. Moreover, you can study and analyse the outcome of Strategy I under different scenarios. The below spreadsheet notes explain how you can use the spreadsheet to apply what you have learned so far.

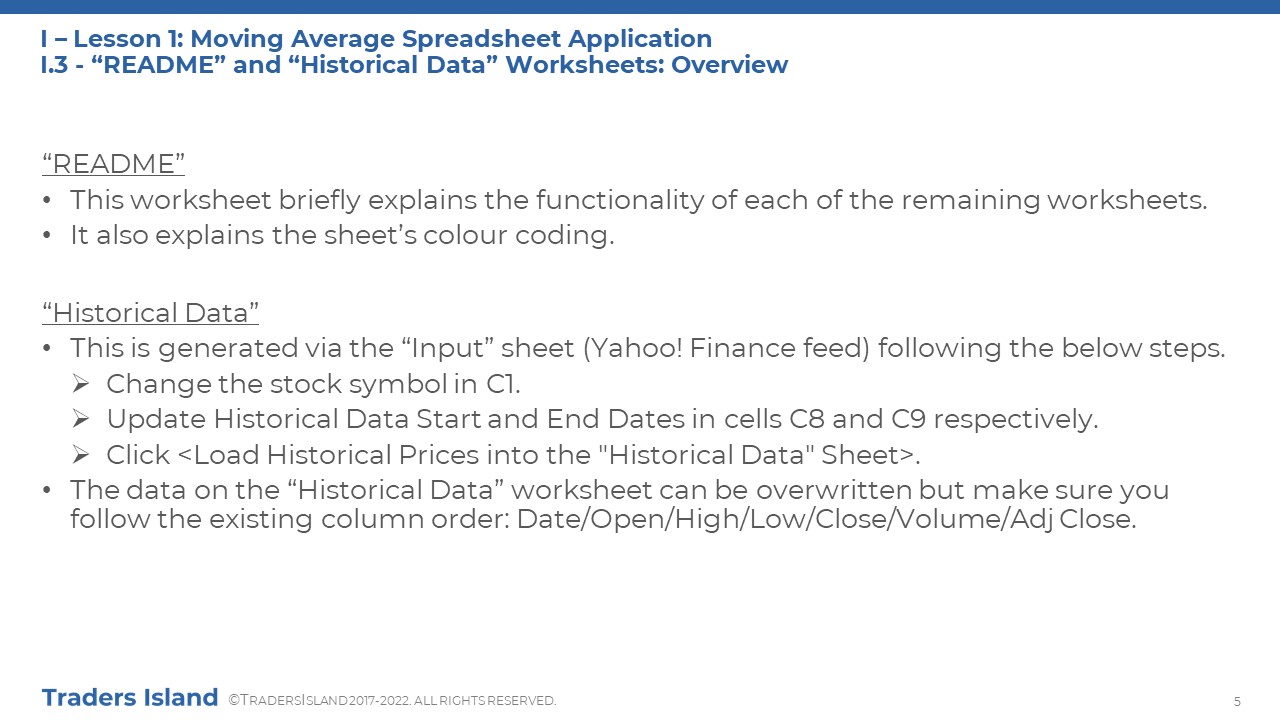
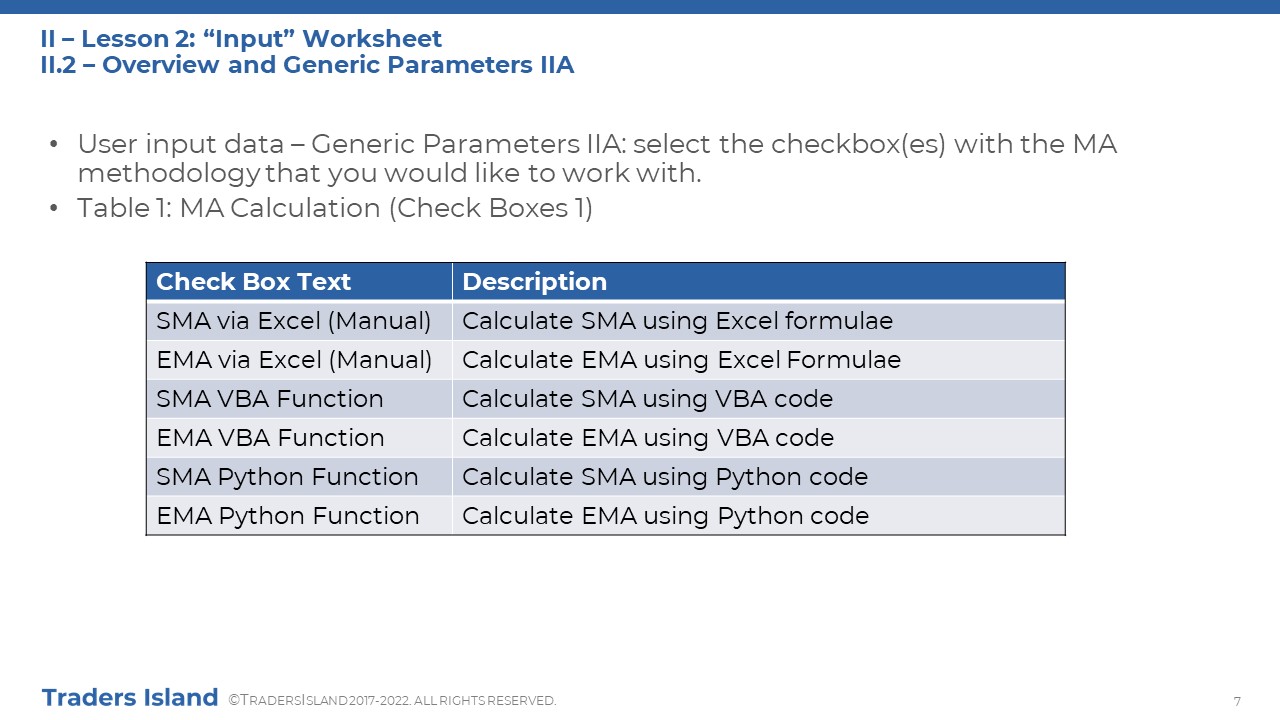
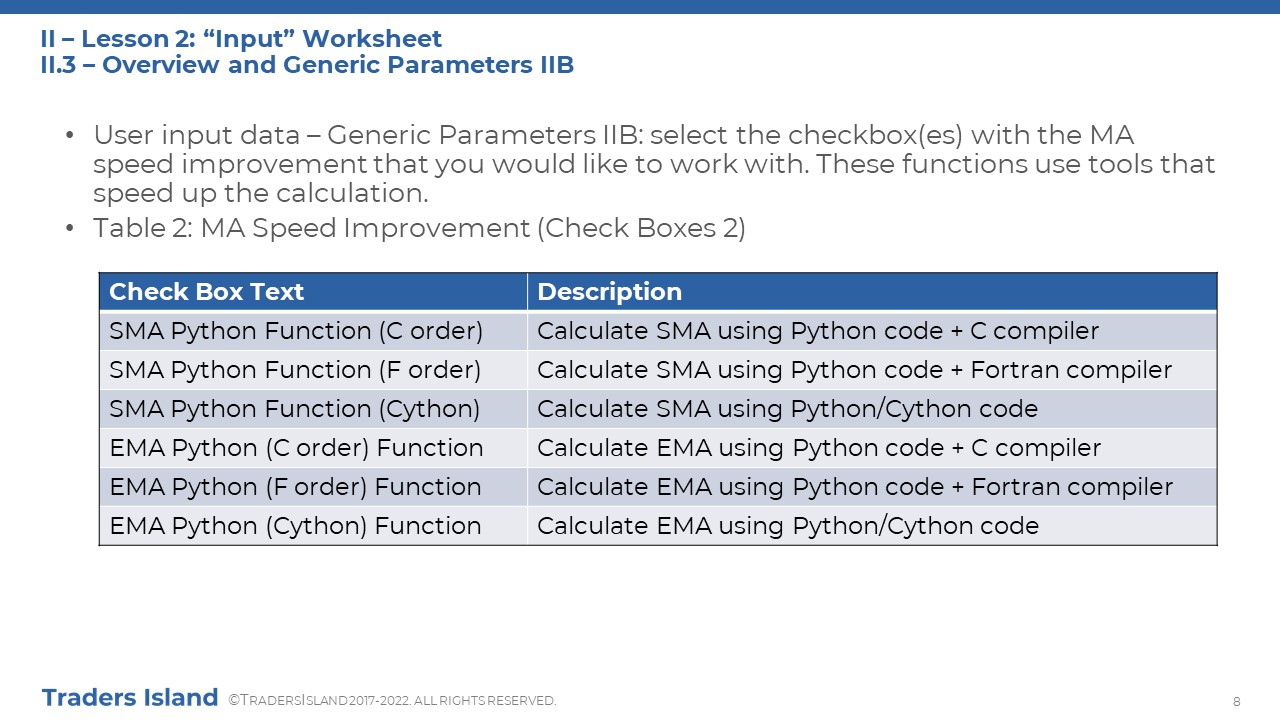
Spreadsheet Notes
This section presents the material for lesson 6 in a slide format, which can be explored for free as well. You will also be able to download them in a pdf format. In brief, these slides form a mini-guide to the downloadable spreadsheet, helping you to apply what you have learnt in the theory part on your own device.


Conclusion
In this tutorial, we have discussed the much-talked about technical analysis tool, moving averages. We have explained the simple moving average and the exponential moving average, giving plenty of examples. We have also reviewed important concepts pertaining to the construction and/or behaviour of a moving average. The theory part has been finally concluded by discussing three most popular trading strategies based on moving averages. Afterwards, an introduction to the fully automated tools offered on this website, namely the platform and the spreadsheet, has been made. The key takeaway behind all of this is that you understand moving averages theoretically as well as empirically and so, even if you decide that moving averages are not for you, you would have done so based on an informed decision!

FAQs
Have a question on moving averages? Check out answers to some popular questions below. Alternatively, write to us!
Do I need to understand Technical Analysis before I learn about Moving Averages?
There is no pre-requisite to understanding the concept of Moving Averages apart from having basic maths skills. However, it is advisable to read about Technical Analysis as it can help you put what you learn here into context. We have dedicated one whole page for explaining the basics of Technical Analysis (and more!) here.
Is Moving Average the only trend-following indicator in Technical Analysis?
The Moving Average is not the only trend-following indicator in technical analysis. However, it is one of the most popular such indicators. Other trend-following indicators include the Relative Strength Index (RSI) and Moving Average Convergence Divergence (MACD).
Before You Go...

Beginning Trader
I am all confused; I am only just getting started. Please take me back to the basics! I would like to start from the very beginning.

Technical Analysis
A bit rusty on Technical Analysis? Not to worry, we have dedicated many pages that explain Technical Analysis in depth.

Fundamental Analysis
Would you like to find out more about Fundamental Analysis? Why not explore the pages we have dedicated for that?